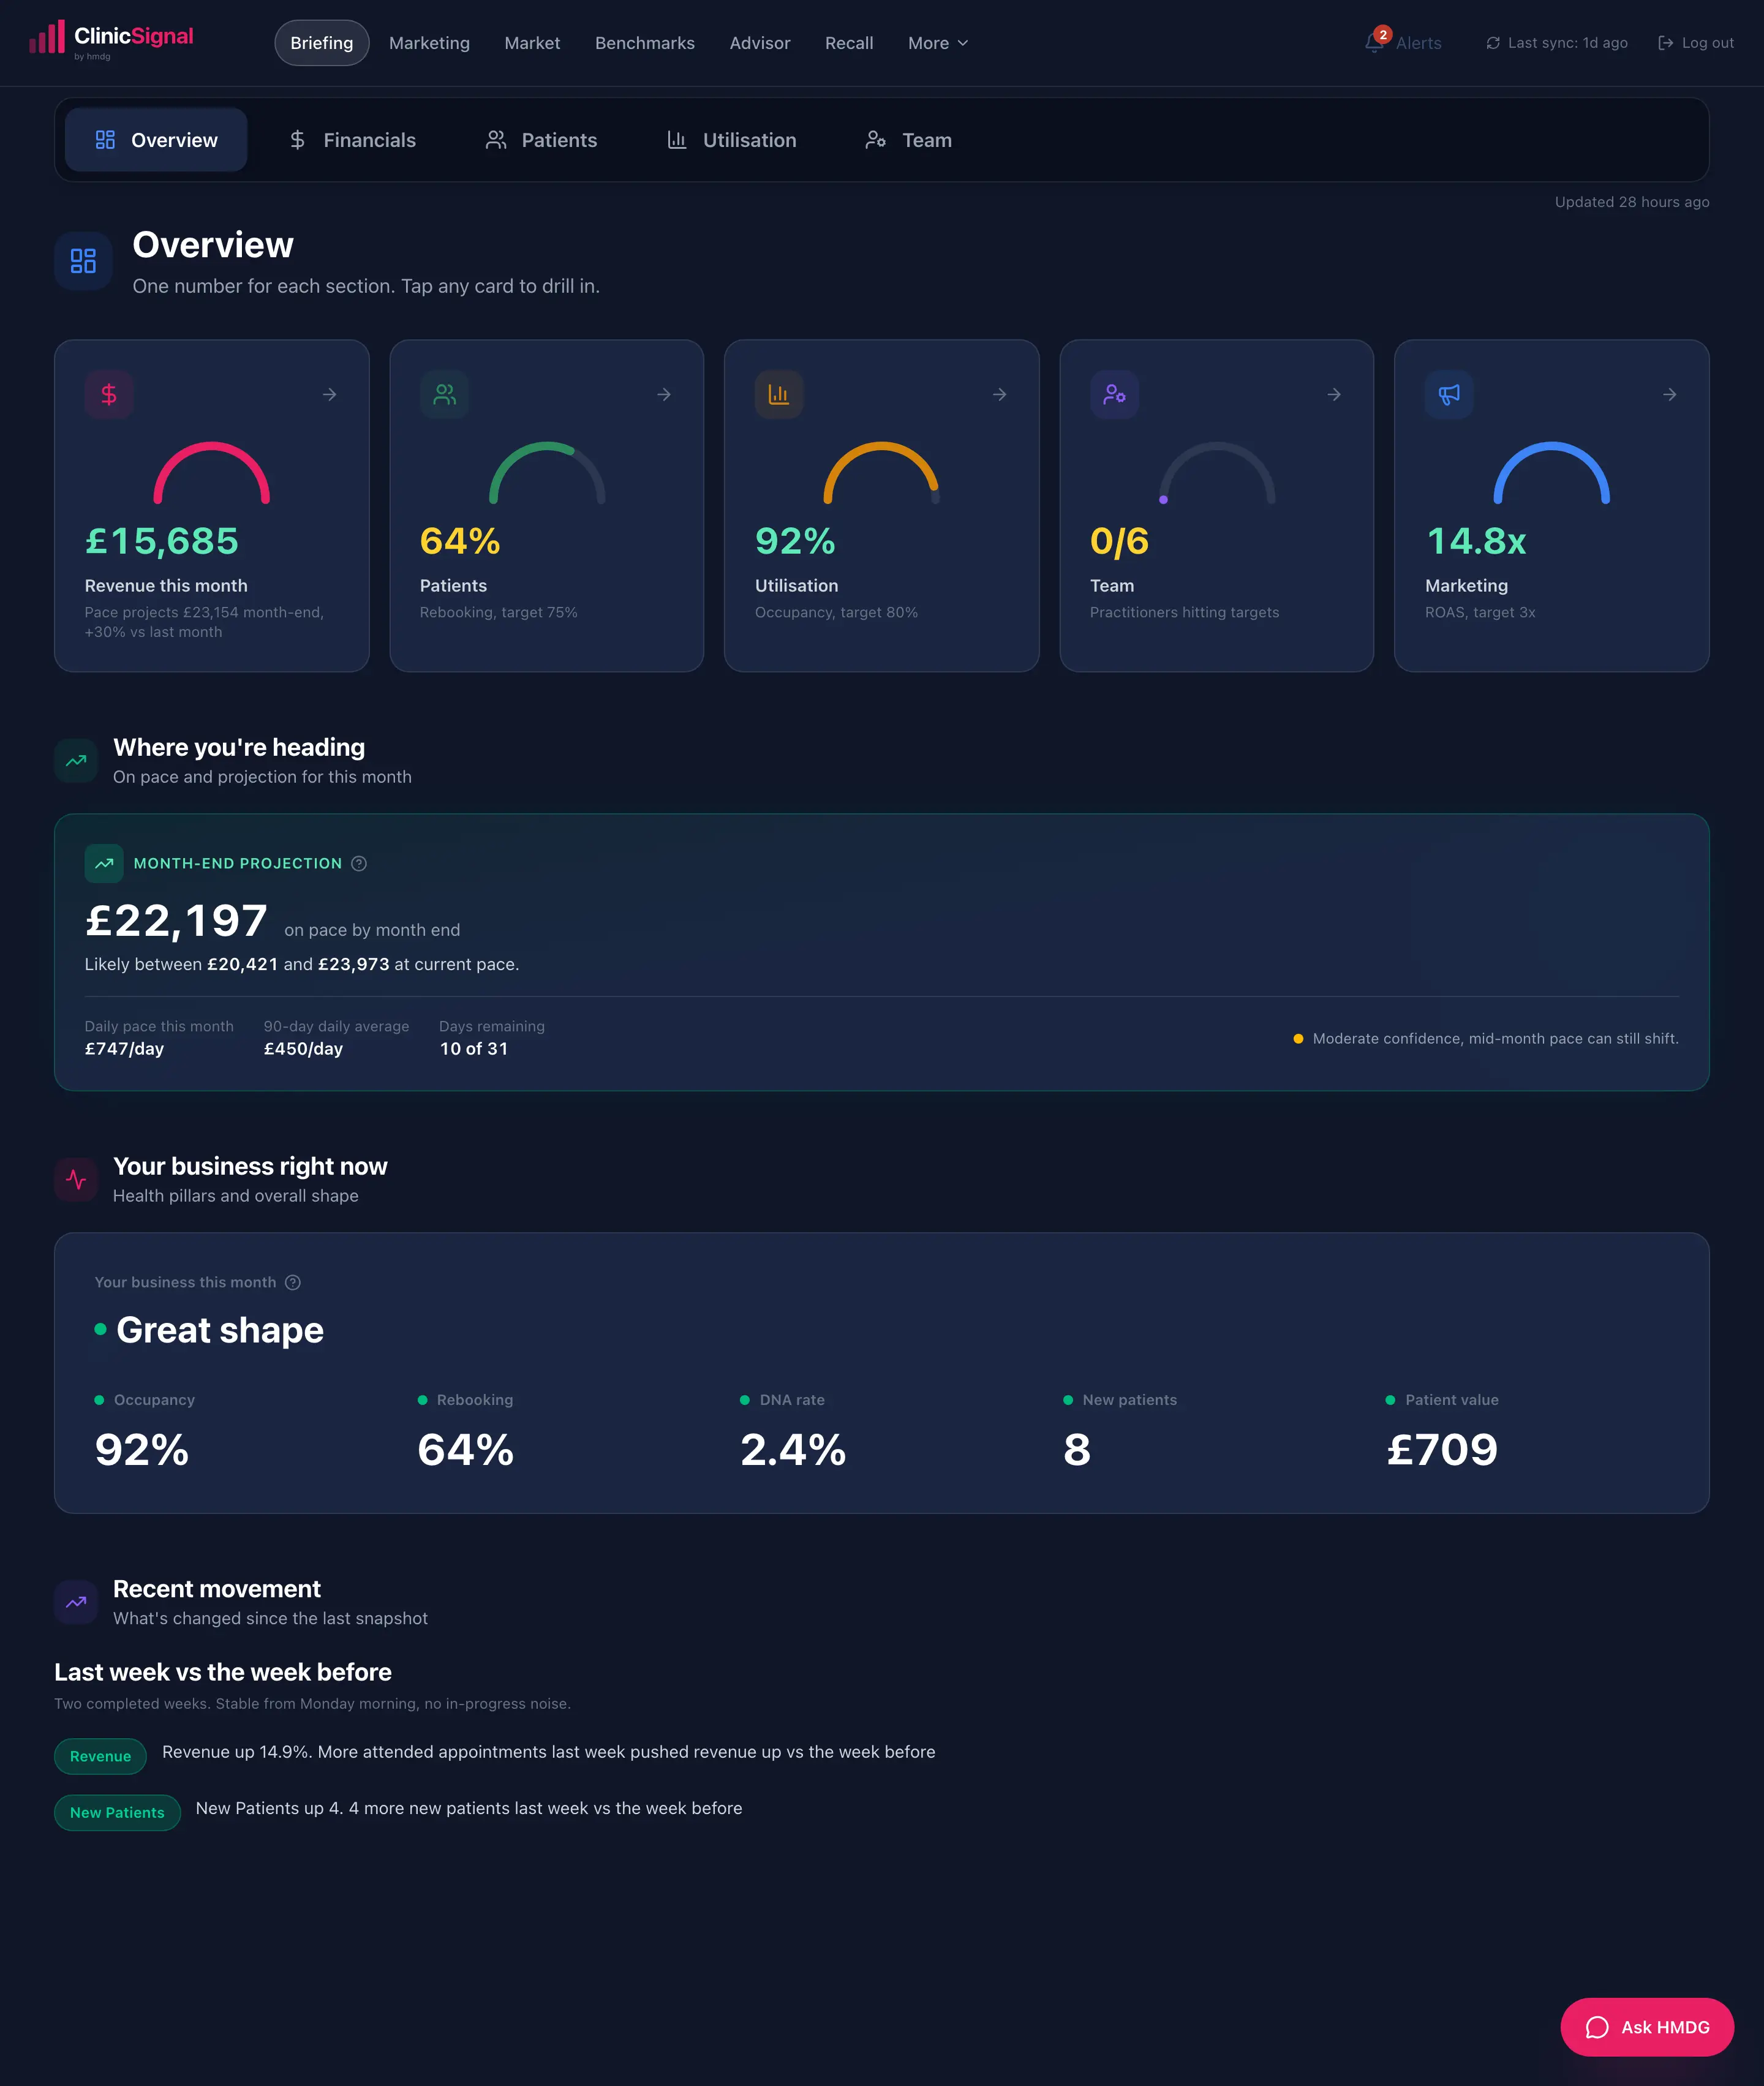
One number for each part of the business.
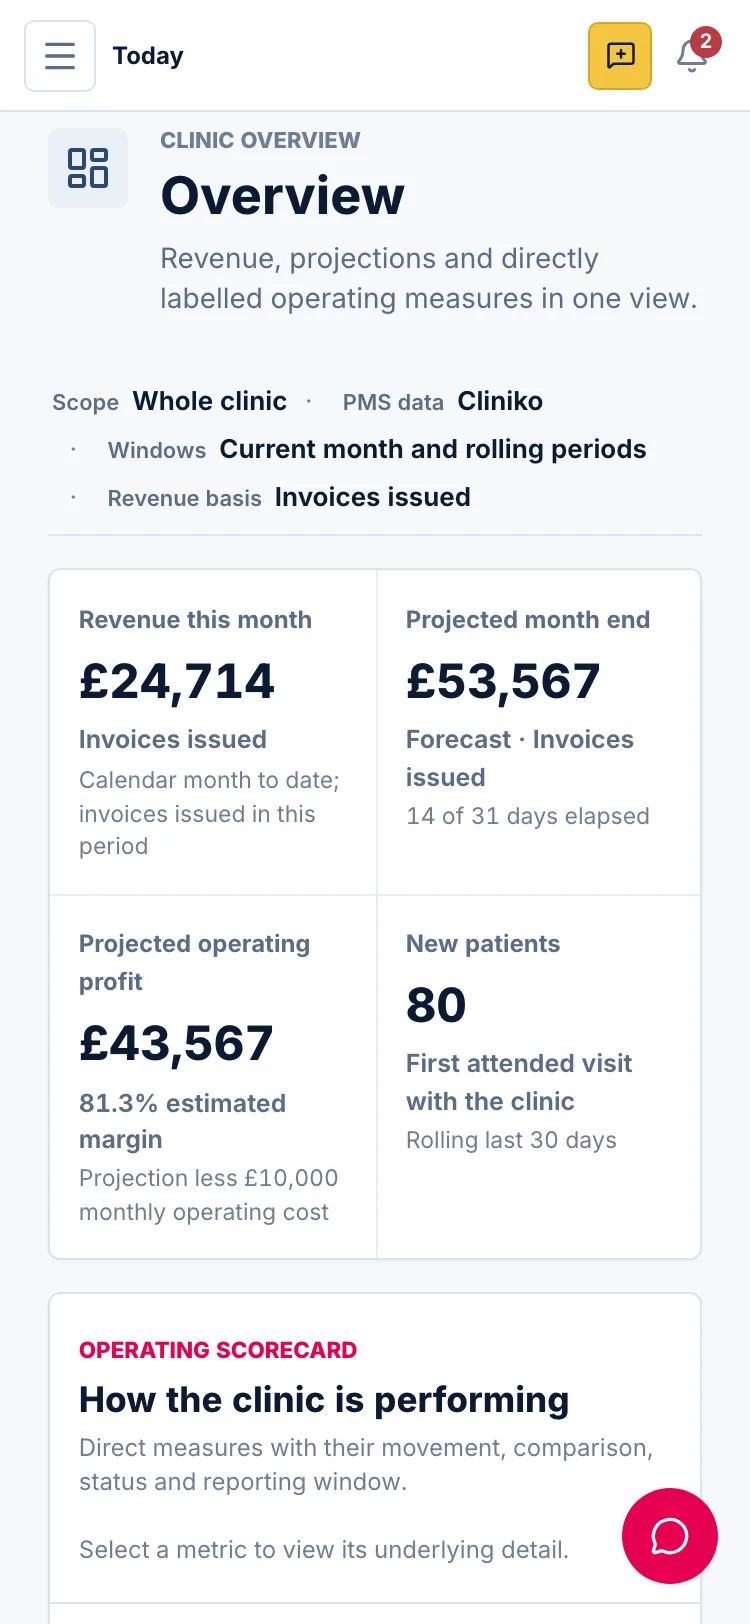
Five dials: revenue with a month-end projection, patient rebooking, utilisation, team and marketing. Below them, where you are heading, where your new patients came from, and what moved since last week.
- Month-end projection with a confidence range
- Acquisition mix from the referral sources in your PMS
- A calm note when a dip is expected rather than a worry
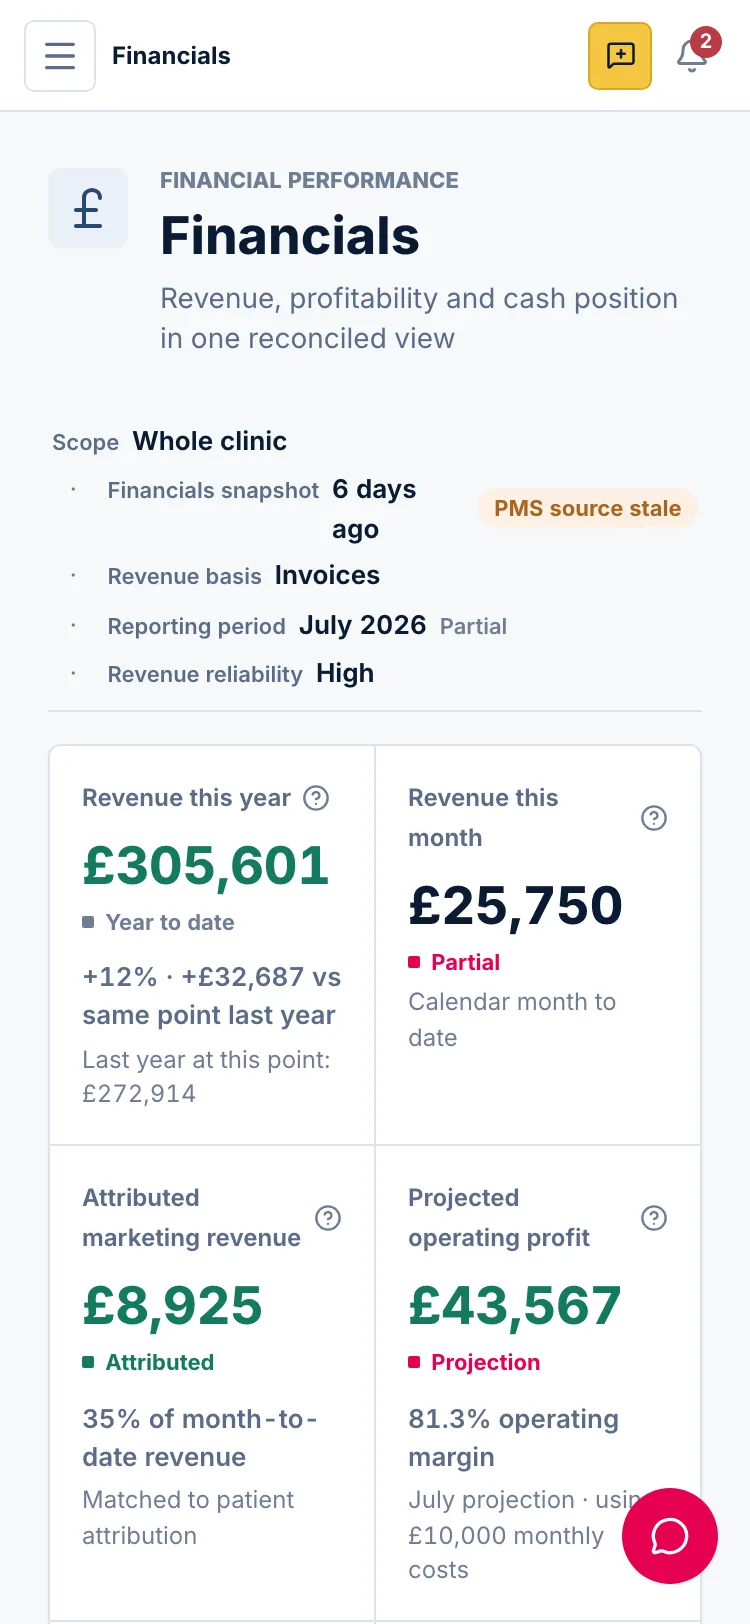
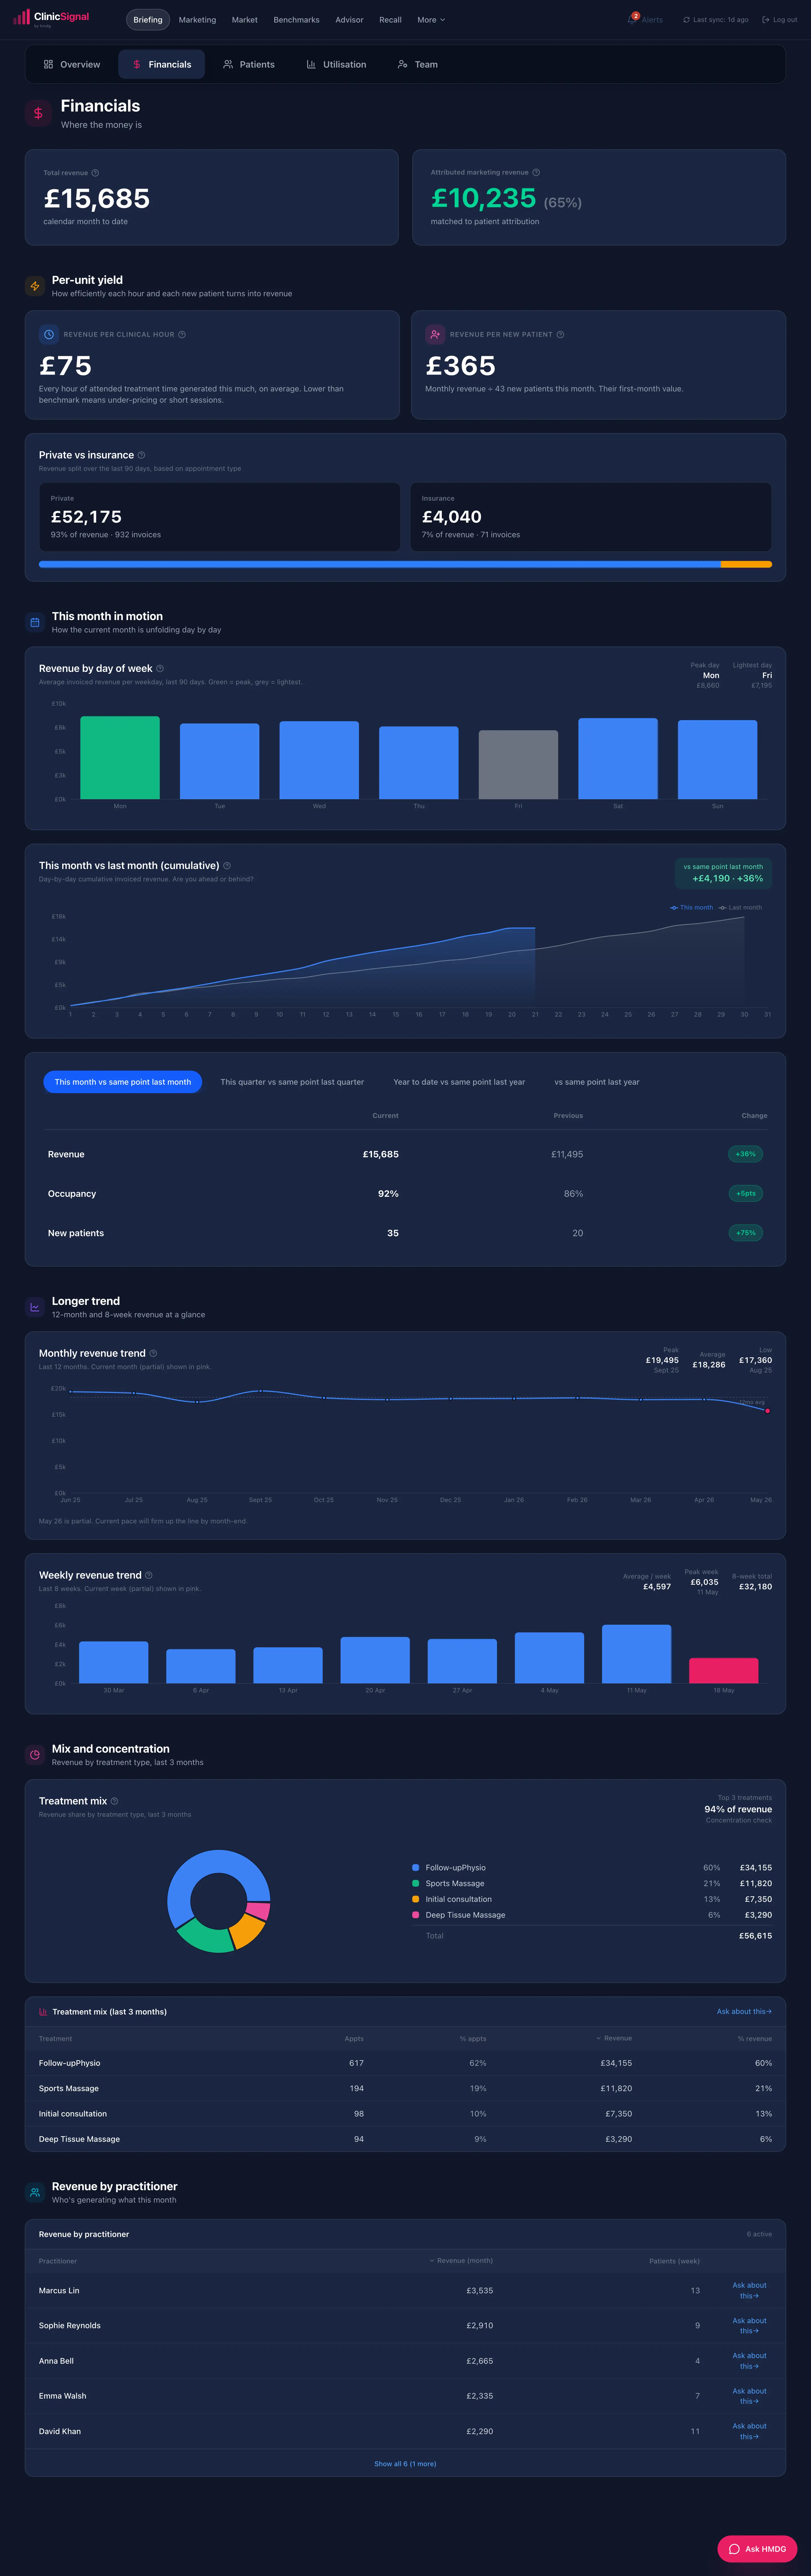
Where the money is, and where it leaks.
Revenue year to date against last year, a monthly year-on-year trend, money owed to you by age, payor mix from real payments, and revenue by day, treatment and practitioner.
- Year-on-year trend, complete months only, no early-month noise
- Outstanding invoices and attended-but-unbilled work
- Every revenue figure on your clinic's own billing basis
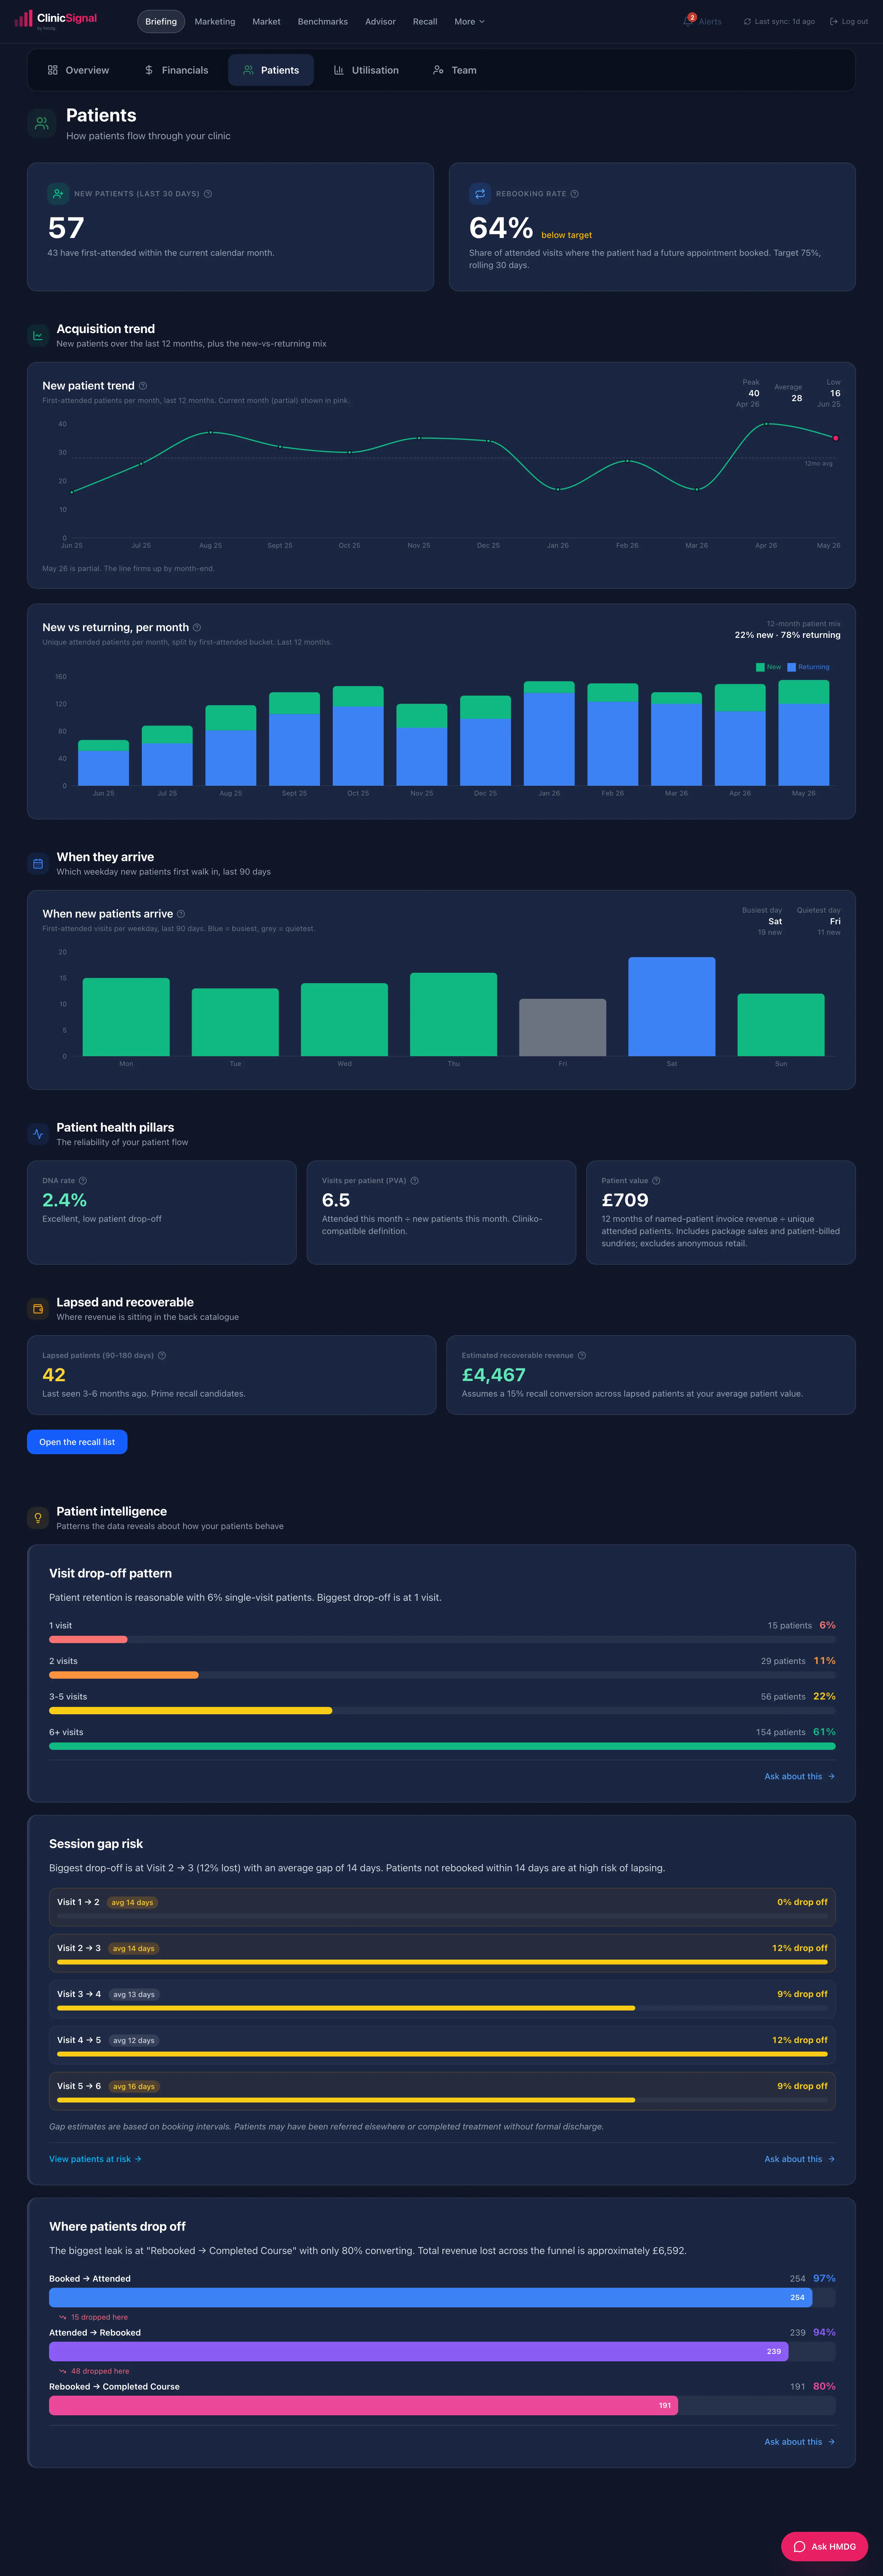
Who is coming back, who is slipping away.
A closed-cohort intake funnel that tells the truth about return rates, the value of a patient as it builds over months, and the patients who have quietly gone quiet, ranked by what they were worth.
- Booked, attended and returned on one honest base
- Patient value curve by months since first visit
- Drop-off by clinician, framed as coaching not blame
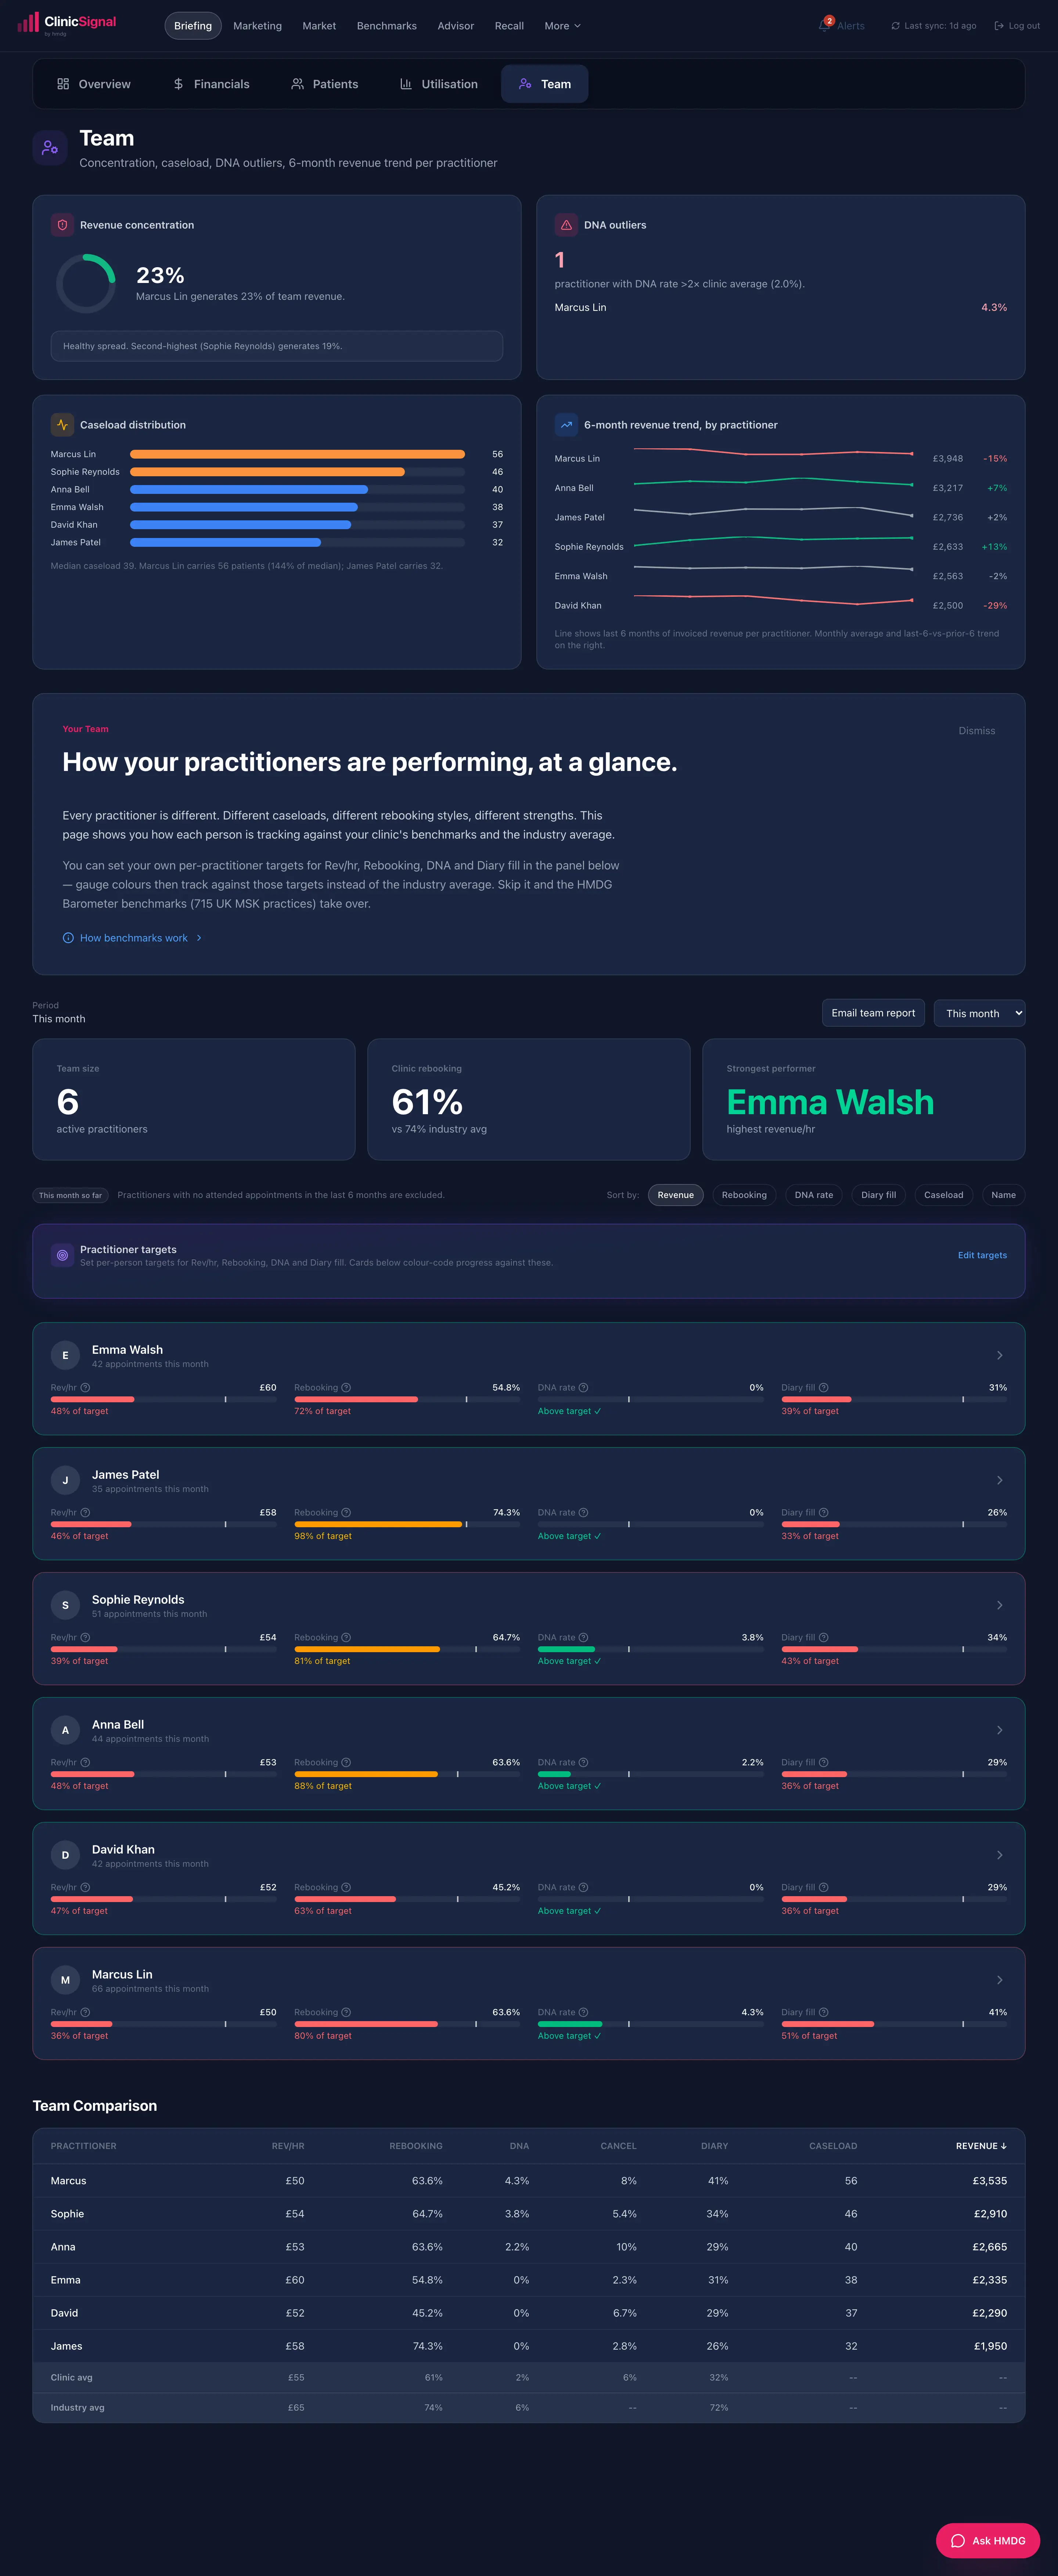
Supportive numbers for every practitioner.
Per-clinician cards with revenue per hour, rebooking, no-shows, new-patient conversion and diary fill against real rostered hours. Set targets where you want them and the cards track progress.
- Diary fill against true rostered hours, not guesses
- Days-to-follow-up and new patient conversion
- Targets per practitioner, tracked automatically
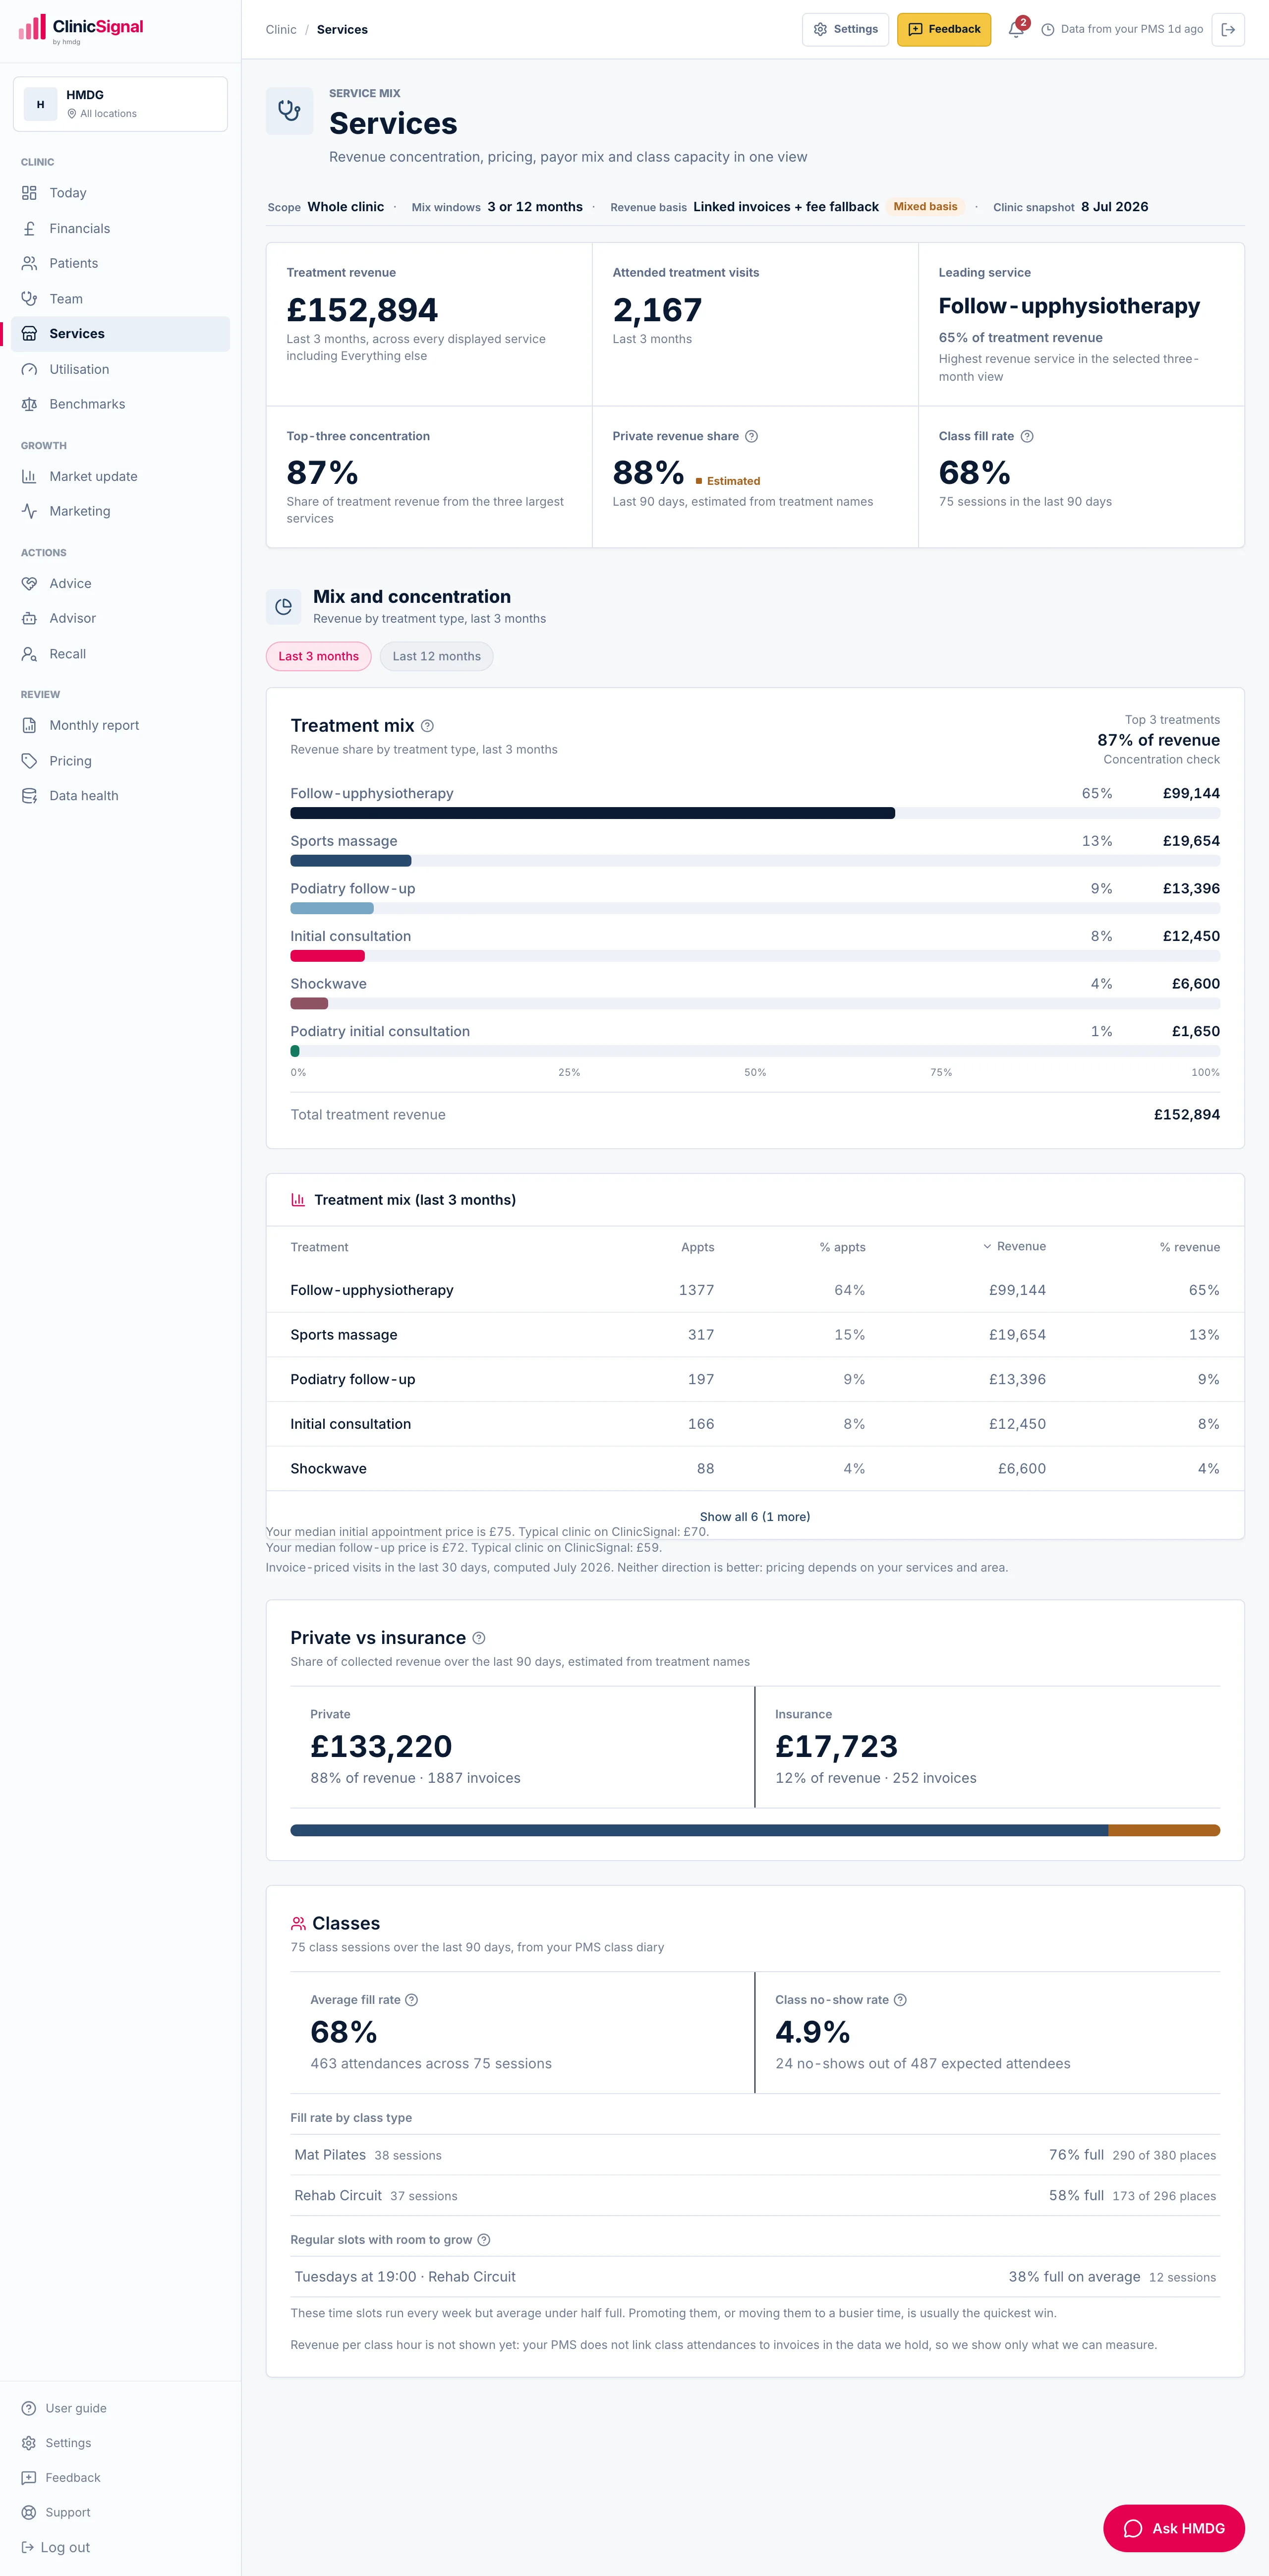
What you sell, and what it earns.
Treatment mix over three or twelve months, revenue by treatment, concentration risk, the private versus insurance split, and class economics shown separately from one-to-one work.
- Revenue concentration by service, flagged when risky
- Insurance versus private split
- Class and group session economics on their own
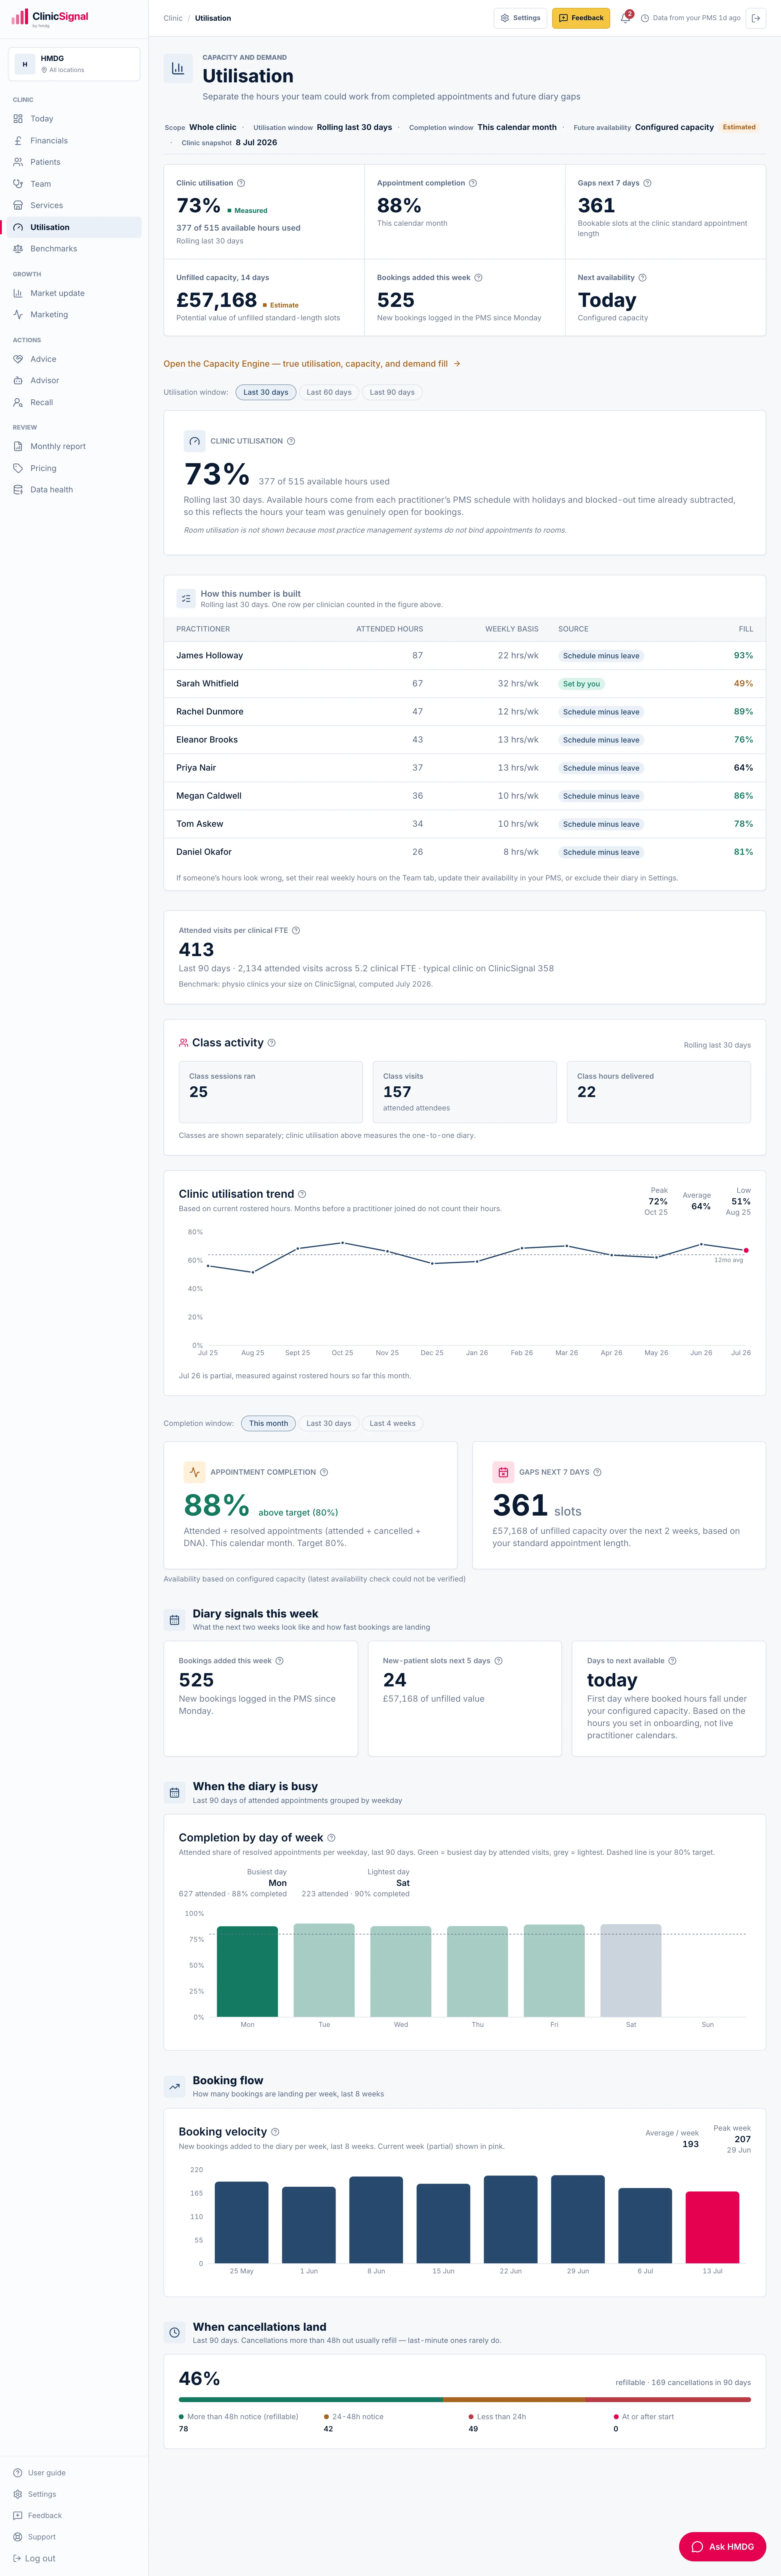
How full the diary really is.
Utilisation against real rostered hours pulled from your PMS, a 12-month trend, cancellation lead times and where the gaps are by day and practitioner.
- Real rosters, not an assumed working week
- 30, 60 and 90 day windows plus a 12-month trend
- Overtime shows as over 100 percent, because it is
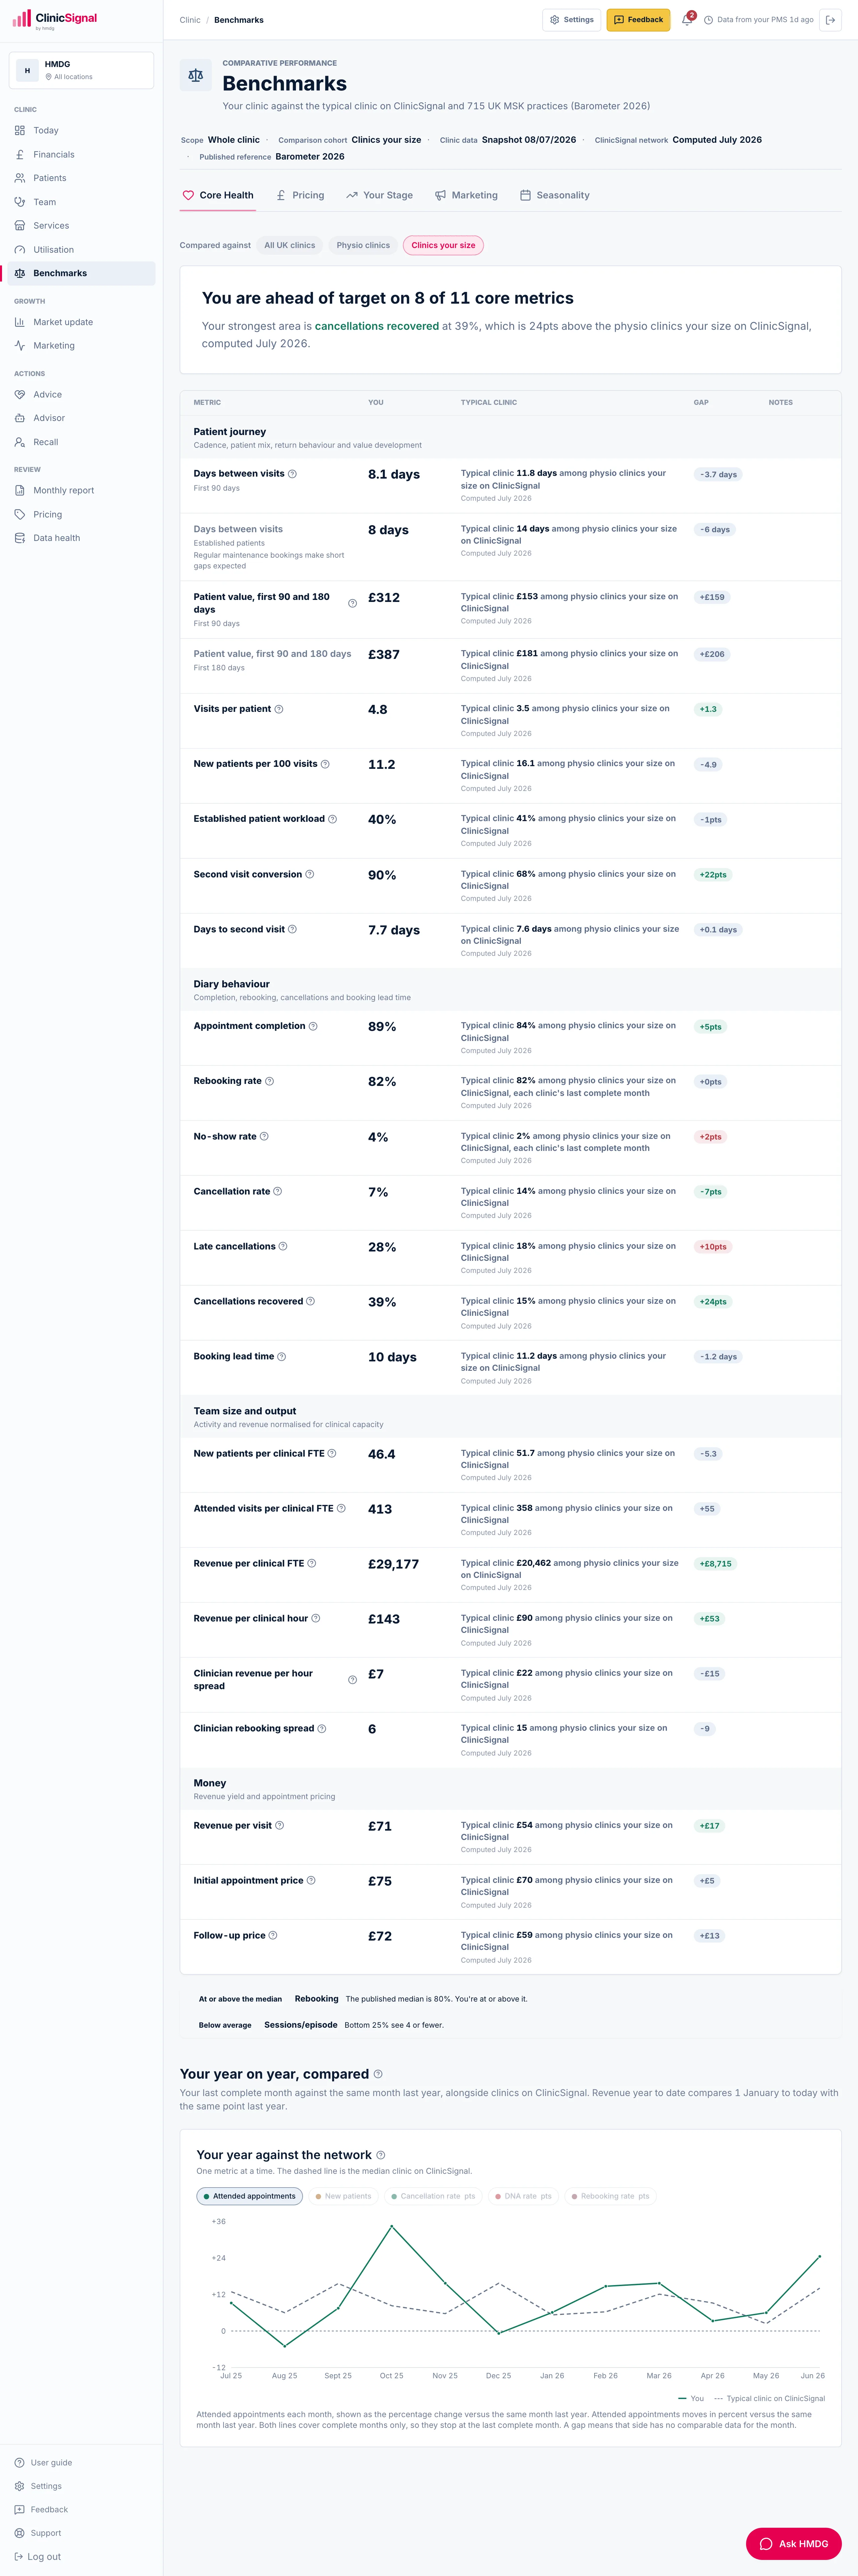
Your year, against clinics like yours.
23 comparisons against the typical clinic on ClinicSignal, from days between visits to revenue per clinical FTE, computed nightly from clinics of your discipline, size and revenue band. Below a fair sample size it falls back to the 2026 Barometer survey of 715 UK practices and says so.
- Cohort medians by country, discipline and clinic size
- Your year against the network, month by month
- Every comparison names its source