Features/Benchmarks
Benchmarks

How do you compare
with clinics like yours?

23 comparisons, each one your clinic against the typical clinic on ClinicSignal and 715 UK MSK practices from the 2026 Barometer survey. The medians are computed nightly from real clinics grouped by discipline, team size, revenue band and country, so the clinic you compare against actually looks like yours.

/dashboard · Benchmarks
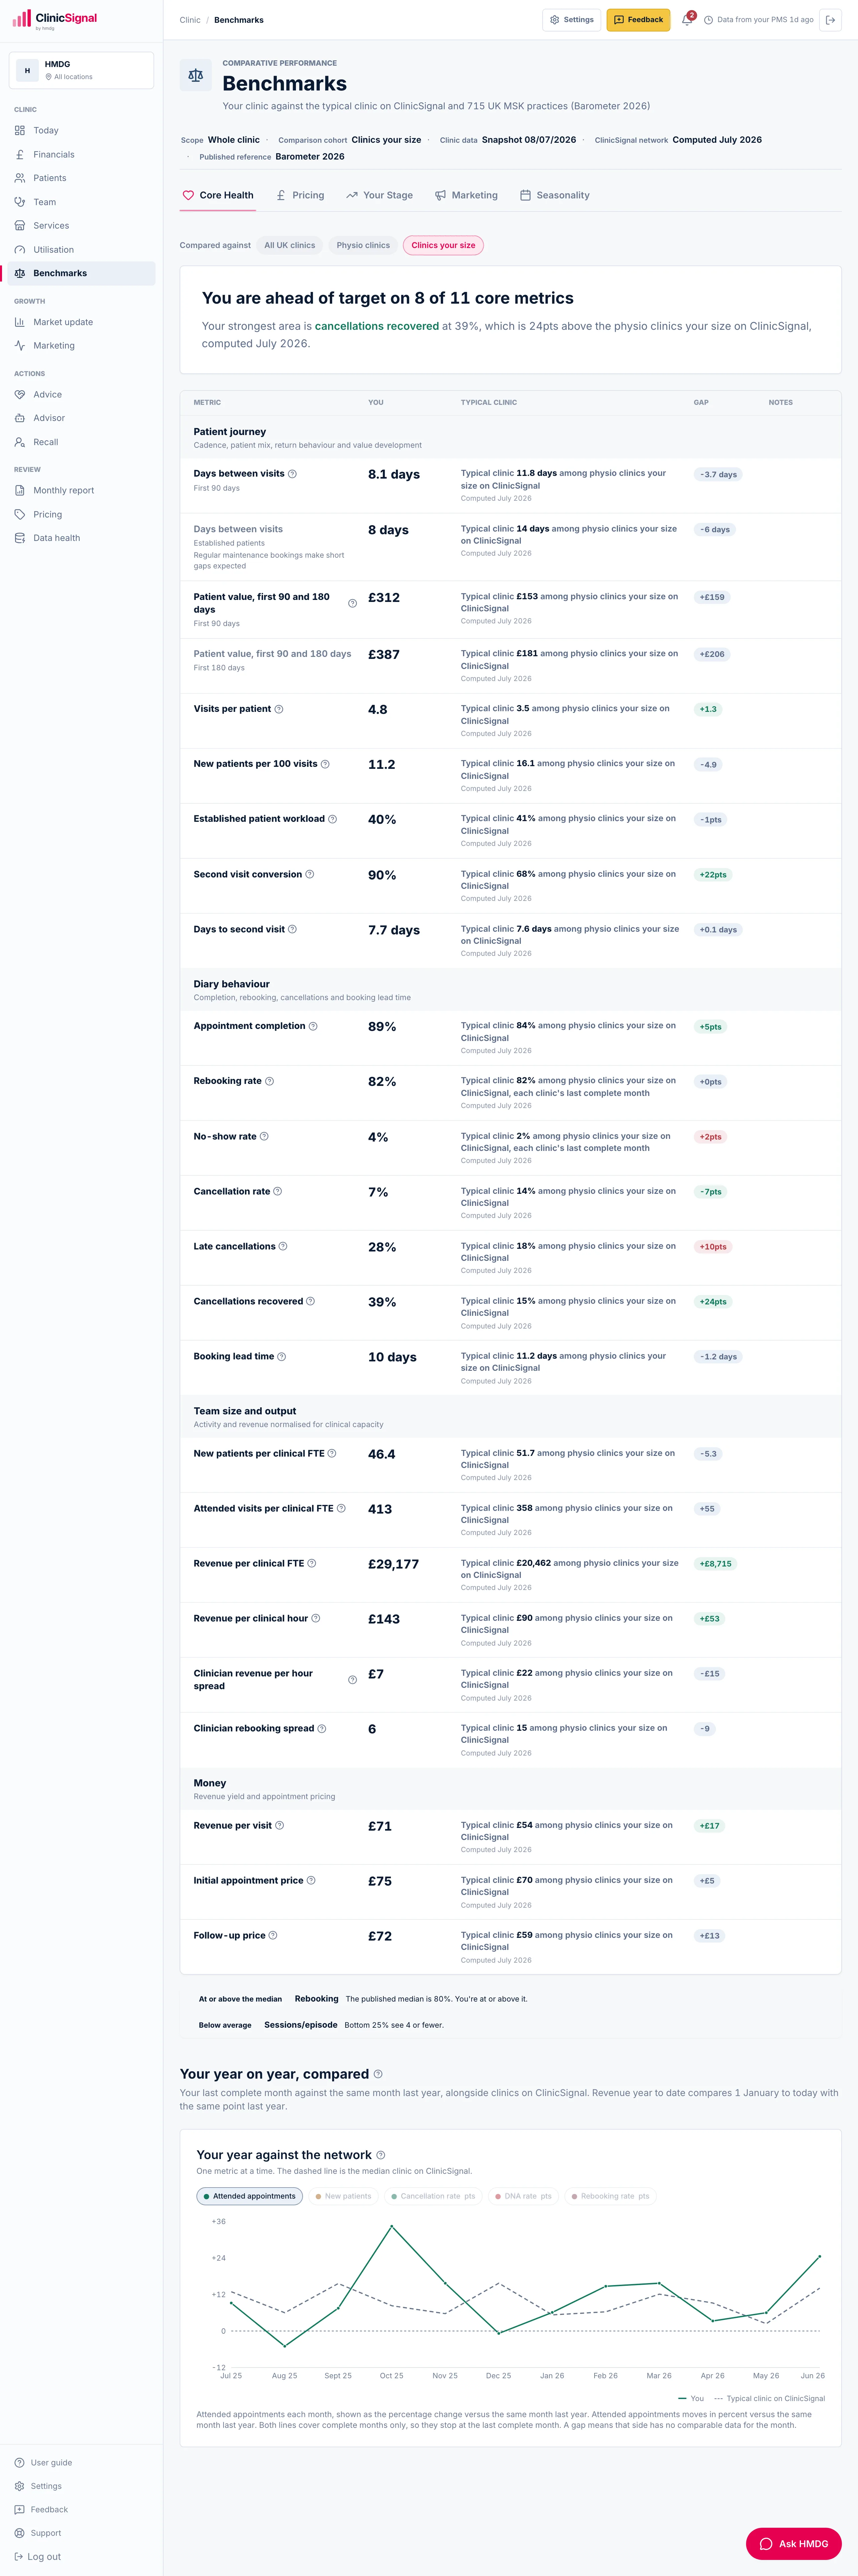
01The headline

One line tells you where you stand.

The page opens with how many of the comparisons you are ahead on, and names your strongest area. Every row below it shows your number, the typical clinic, and which way you have moved.

  • Your own number always shows, with the records behind it
  • The typical clinic figure carries the month it was computed
  • Core health first: completion, rebooking, no-shows, visits per patient
Benchmarks · How you compare
02Patient journey

Reads a maintenance book honestly.

Days between visits is split into the first 90 days and established patients, so a loyal maintenance book is never misread as slow rebooking. Alongside it: second visit conversion, days to second visit, new patients per 100 visits and how much of your week is established patients.
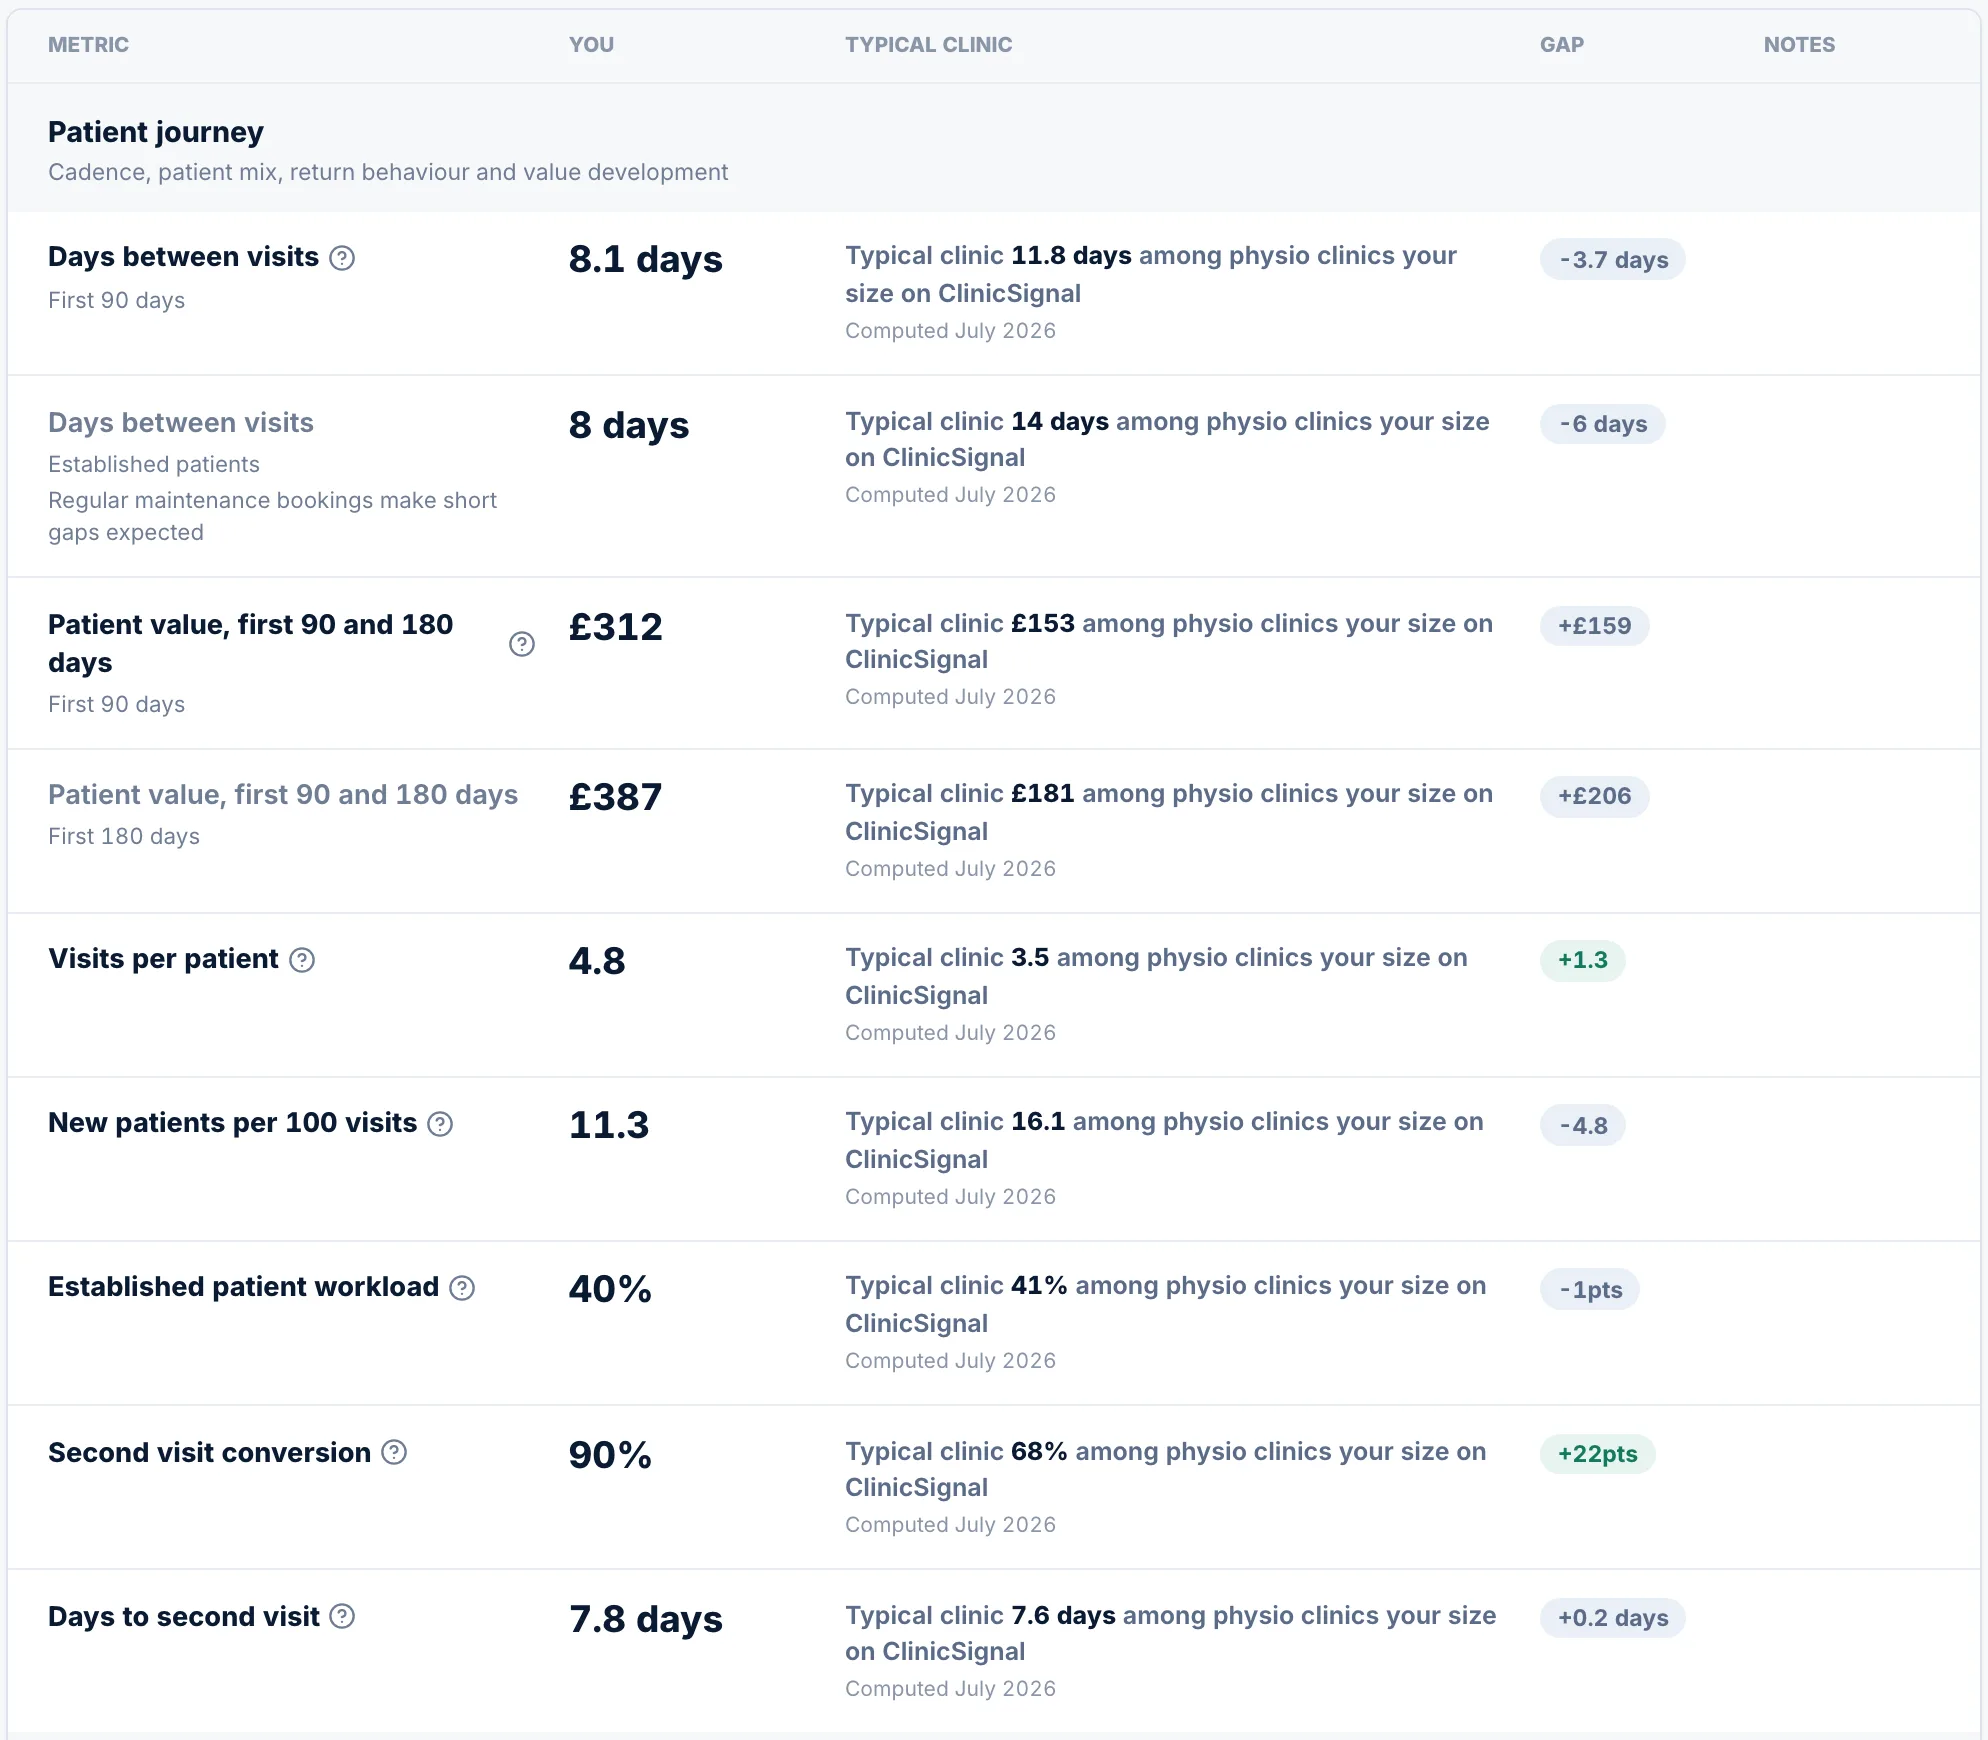
Benchmarks · Patient journey
03Diary behaviour

The habits that fill a diary.

Cancellation rate, late cancellations and booking lead time, plus the one most dashboards miss: how many cancellations you recover within 14 days. A cancellation that rebooks is not lost revenue, and clinics that chase them show it here.
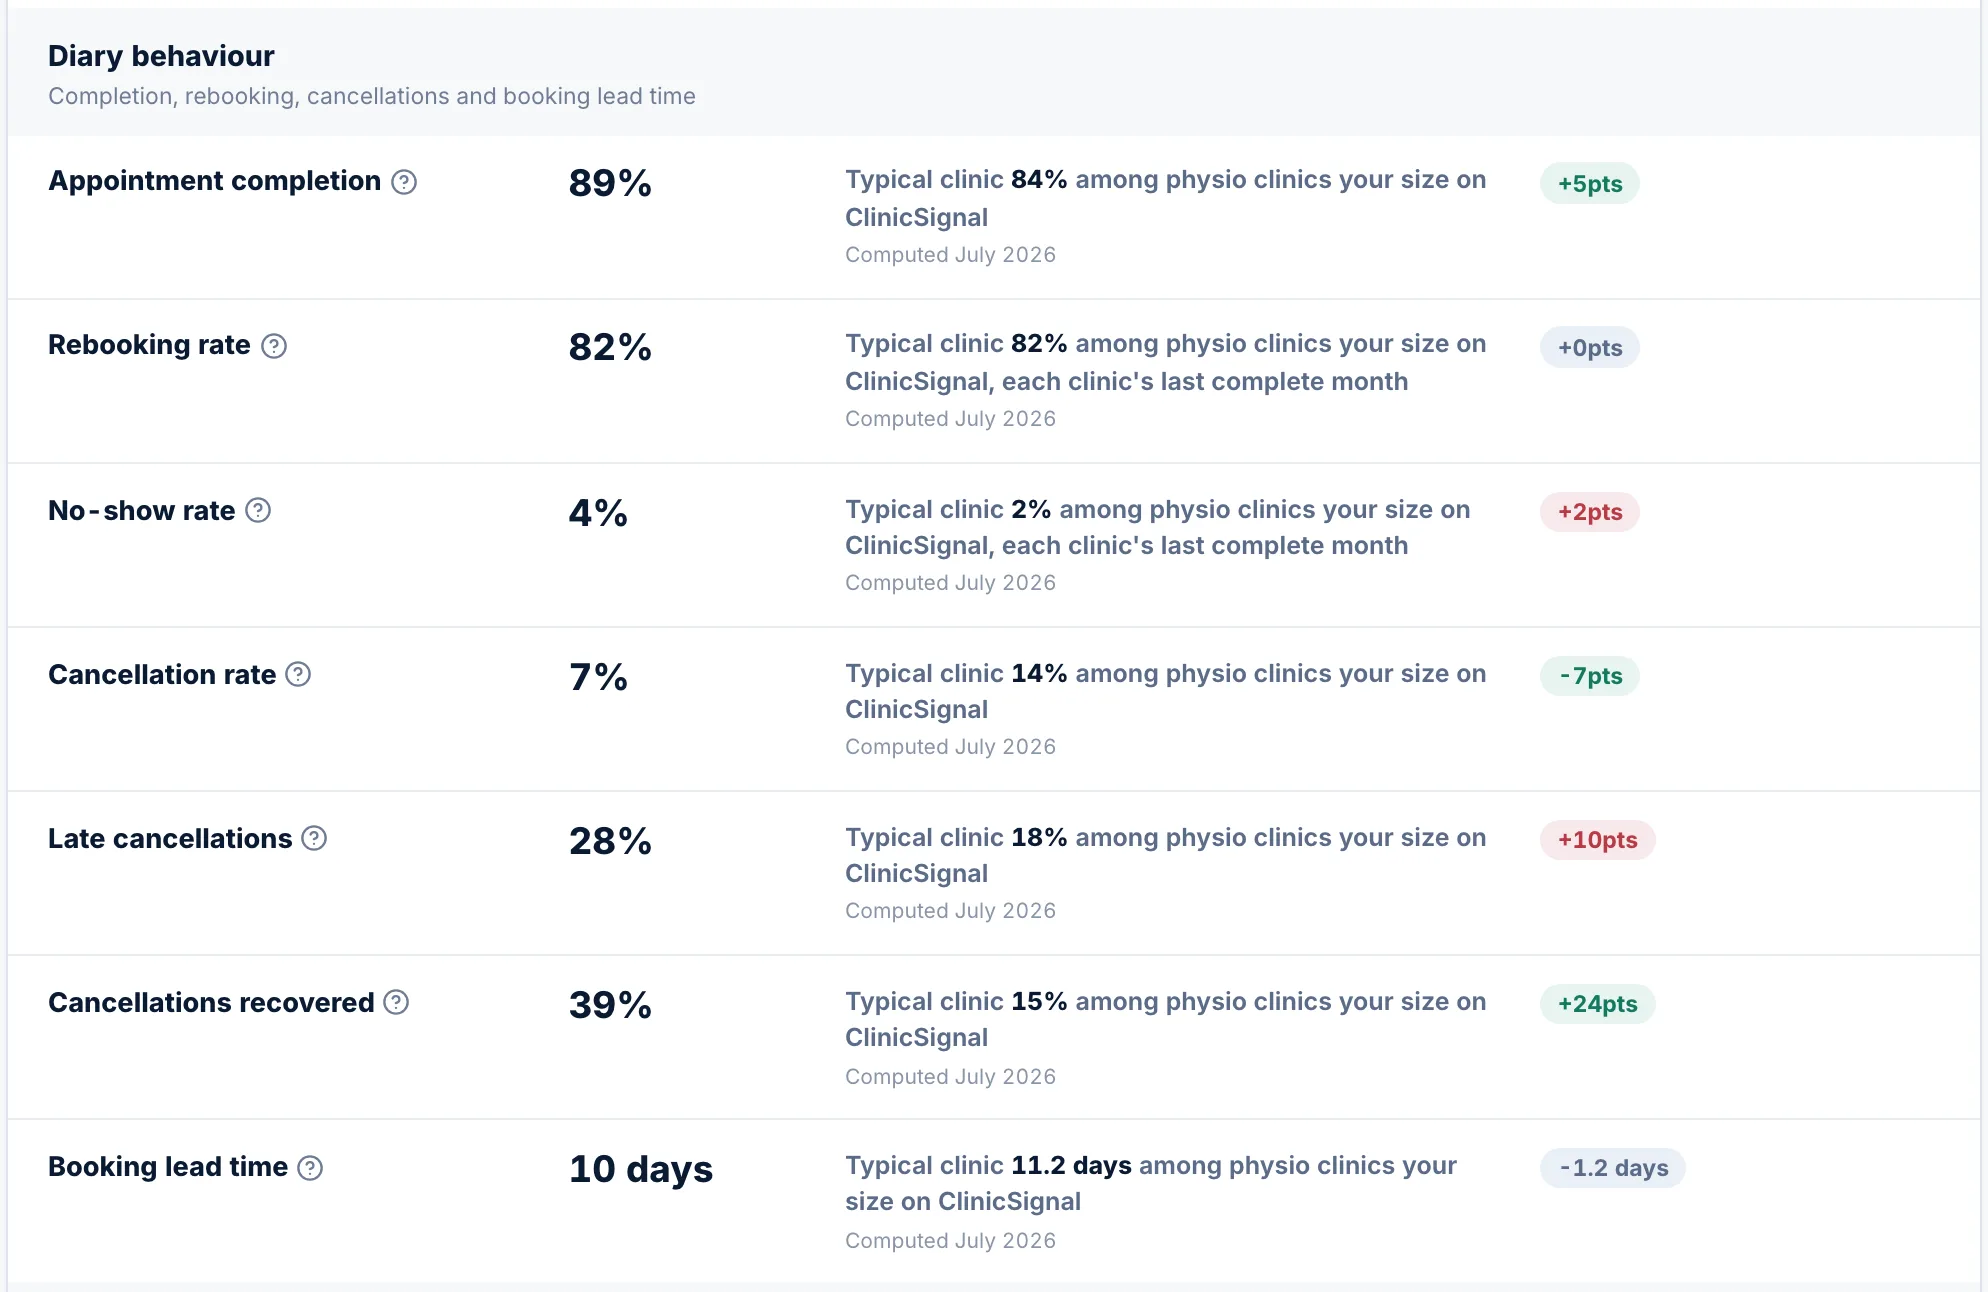
Benchmarks · Diary behaviour
04Team output

Output per clinical FTE, not per head.

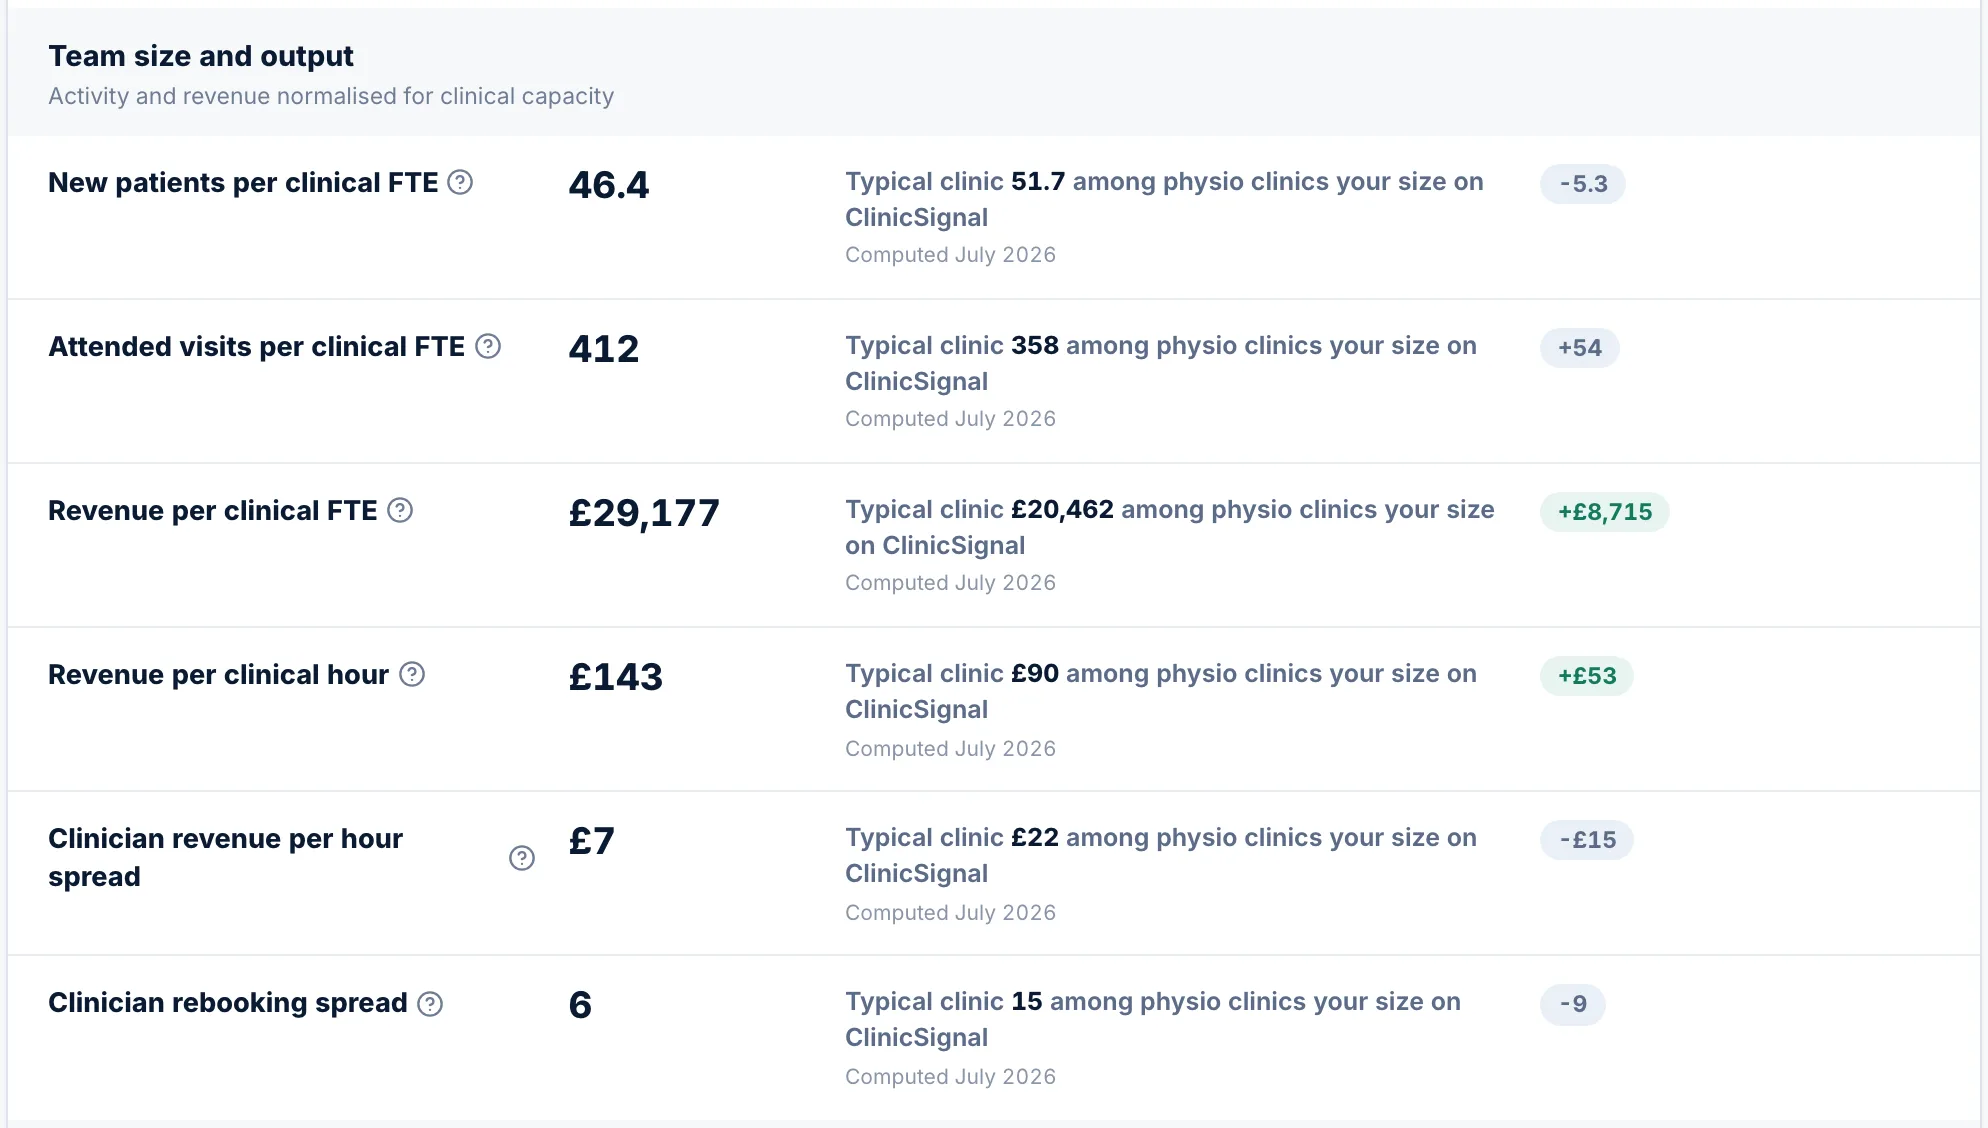
New patients, attended visits and revenue per clinical FTE, plus revenue per clinical hour. Sized by real rostered hours, so a team of part-timers compares fairly against a team of full-timers.
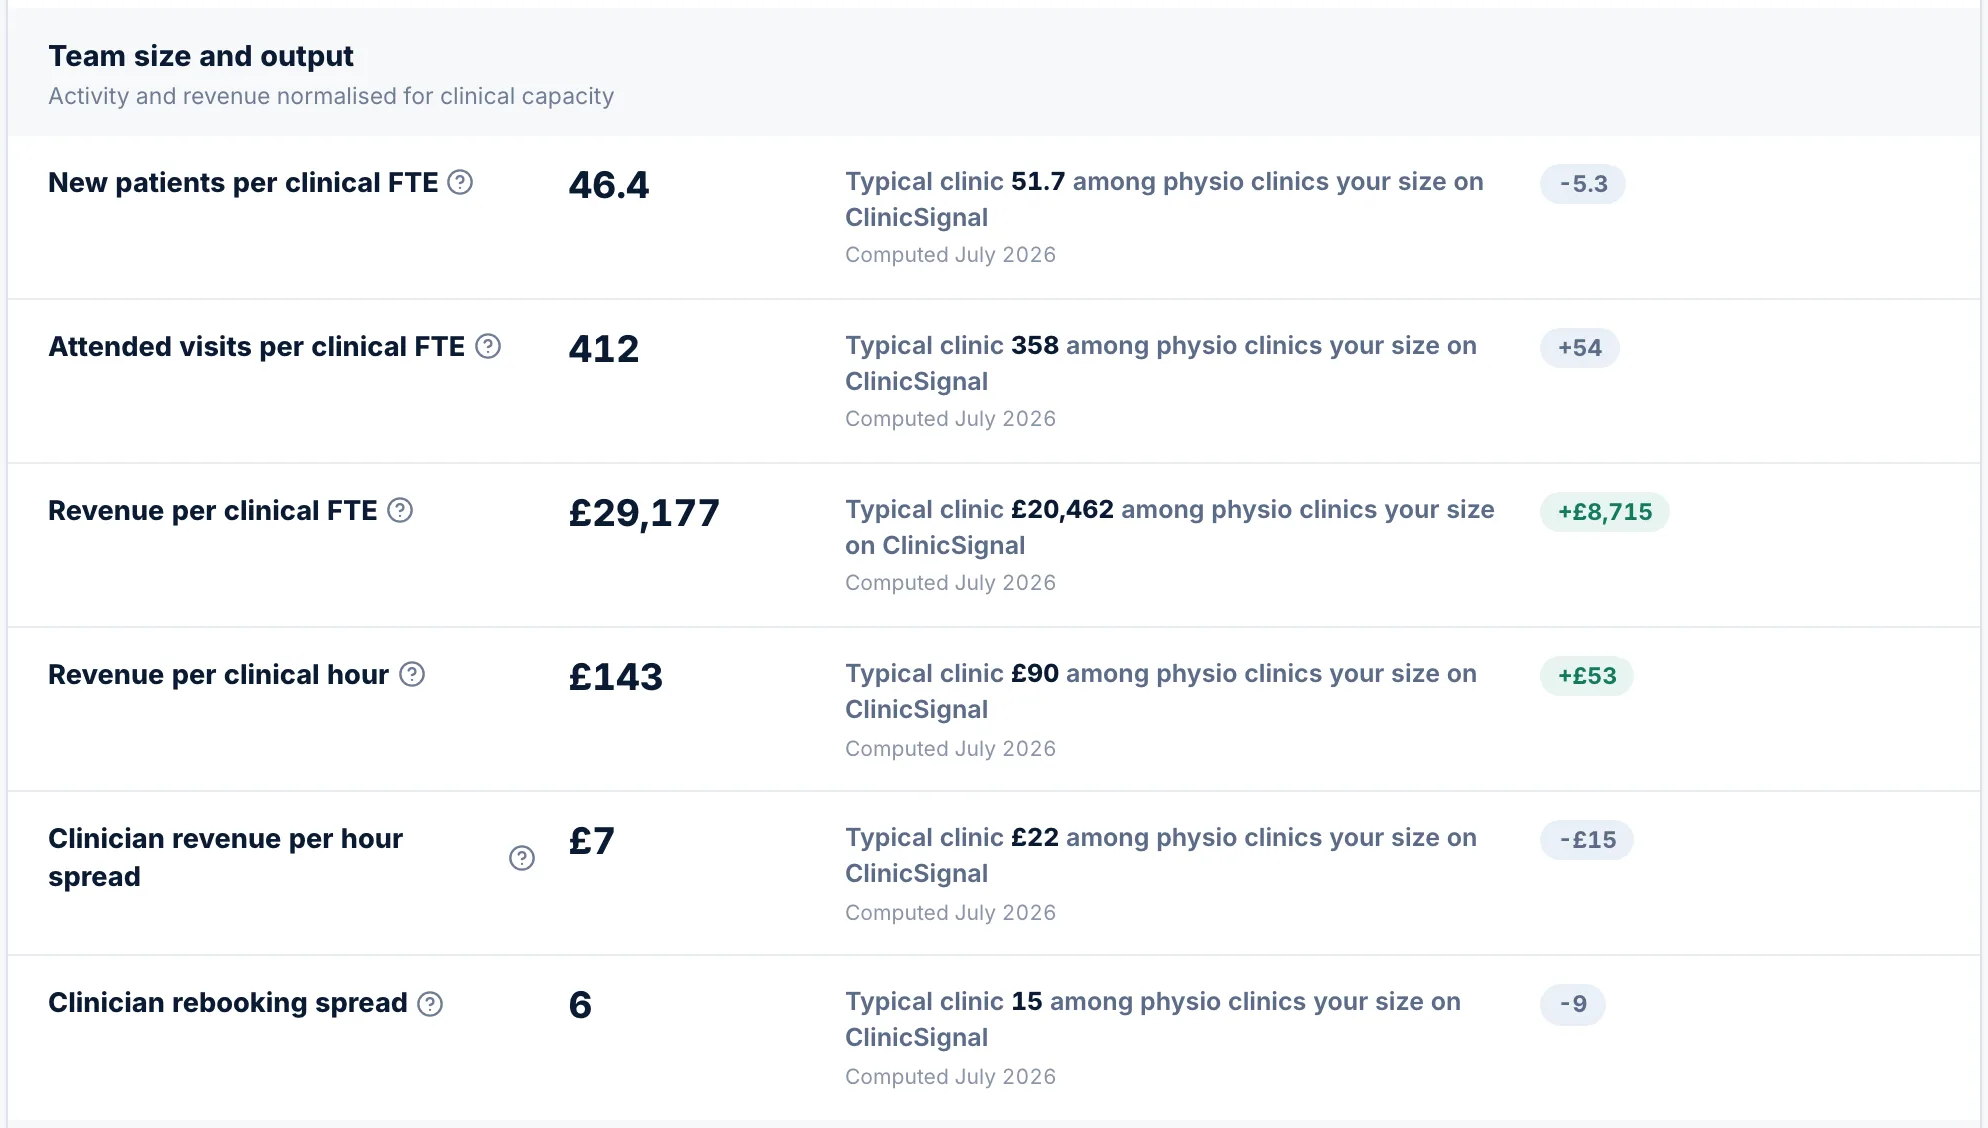
Benchmarks · Per clinical FTE
05Consistency

Spread, without naming anyone.

The gap between your upper and lower quartile clinicians on revenue per hour and rebooking, against the same gap at the typical clinic. A tight spread means a consistent team. A wide one is a coaching conversation, and no individual is ever named.
Benchmarks · Consistency
06The money rows

What a visit and a patient are worth.

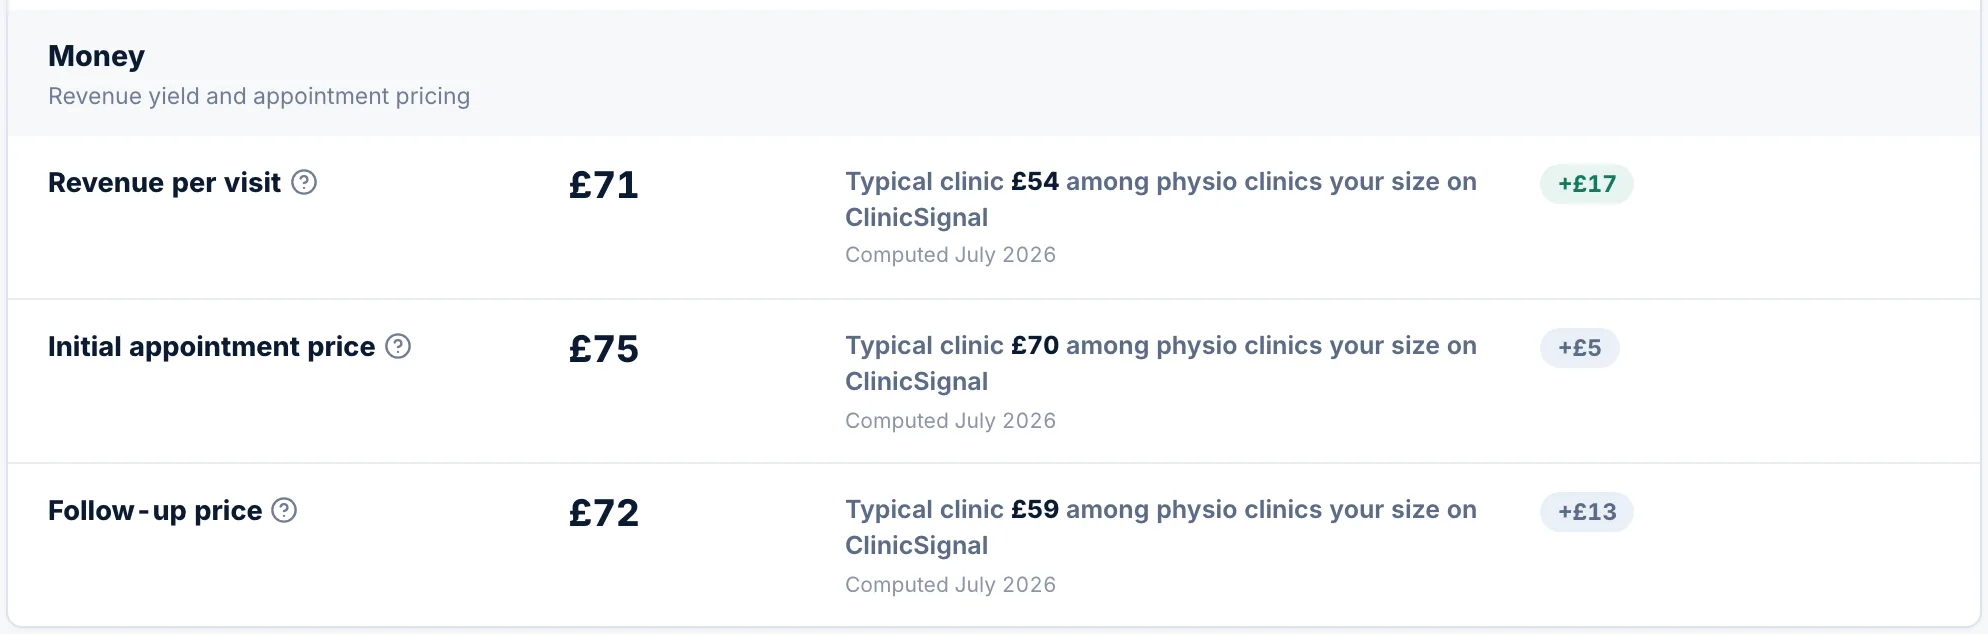
Revenue per visit, patient value at 90 and 180 days, and your initial and follow-up prices, all from real invoices. If there is headroom to charge what you are worth, it shows here first.
Benchmarks · Money
Benchmarks · Money
07Your year against the network

You, versus the typical clinic.

Your year-on-year change plotted month by month against the median clinic on ClinicSignal, on complete months only. Above the dashed line you are outgrowing the network.
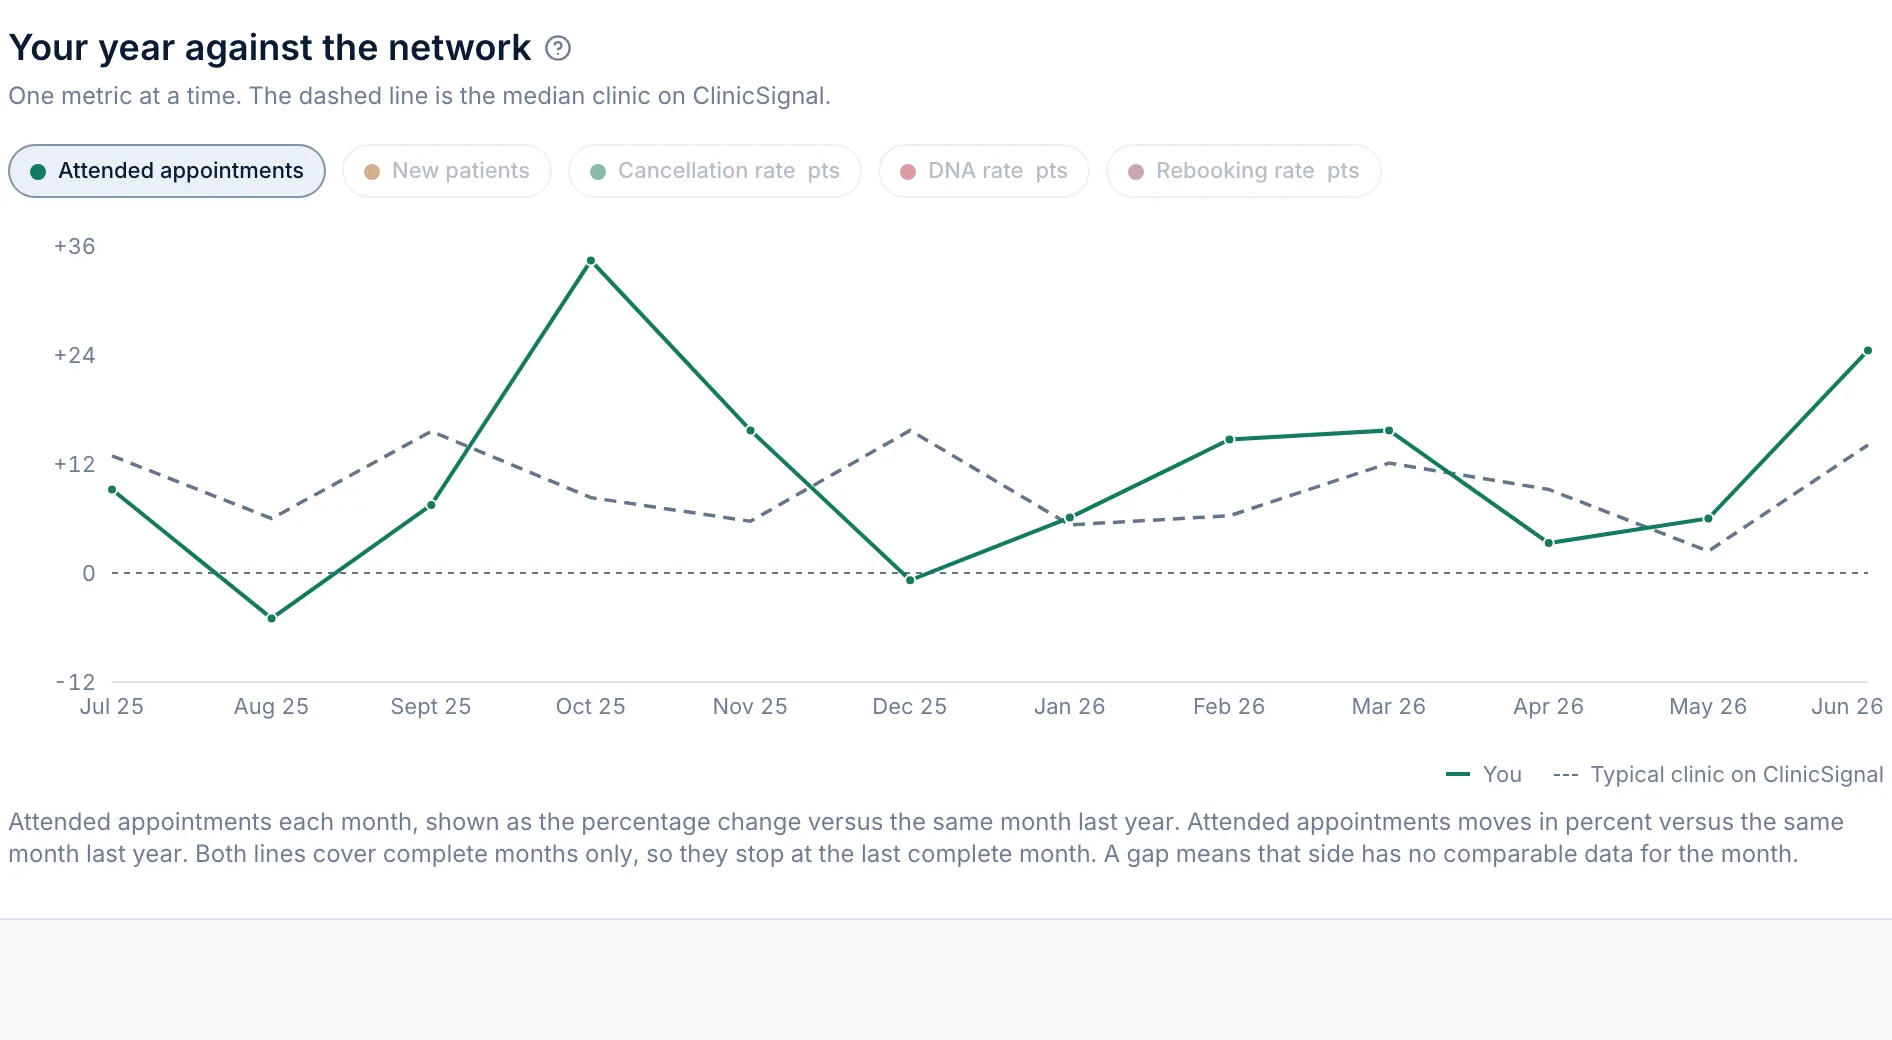
  • Attended, new patients, cancellation, DNA and rebooking
  • Complete months only, no partial-month noise
  • The dashed line is the median clinic, recomputed nightly
Benchmarks · Against the network
08Everywhere you look

The context follows you around.

Benchmarks are not just a tab. The Overview carries a one-line summary of how you compare, the Patients, Team, Financials, Services and Utilisation tabs carry the relevant medians in context, the weekly email and monthly report carry a How you compare block, and the advisor answers "is my rebooking any good?" with the real cohort figure.

  • One line on the Overview, under the dials
  • The relevant median beside the number on every tab
  • A How you compare block in the weekly email and monthly report
Overview · How you compare
The honesty rules

Built so you can trust it.

Your own number always shows, with the records it came from. A median only appears when enough similar clinics sit in the group, and below that floor the comparison falls back to the 2026 Barometer survey of 715 UK practices, labelled as exactly that. No clinic is ever named, and no comparison ever reveals how many clinics sit behind it. If your PMS cannot measure something, the row says so instead of guessing.
How it is worked out

Clinics like yours, recomputed nightly.

Fleet medians are computed every night across clinic groups: your country, your discipline, your team size and your revenue band. The comparison walks down that ladder until it finds a group with enough clinics in it, so a two-clinician podiatry practice is never judged against an eight-physio MSK centre. Multi-site clinics get more than one answer: each site compares as a clinic in its own right, so a strong site cannot hide a struggling one.
Keep exploring
AdvisorAsk if a number is any goodMarket updateIs it you, or the market?TeamThe per-practitioner numbers behind it

See where you really stand.

23 honest comparisons against clinics like yours.

Sign up → Start free trial