See every pound, and every leak.
Revenue on your own billing basis, what is owed to you and how fast it comes in, per-unit yield, and the quiet leaks most owners never get to see. No spreadsheet, refreshed every day.
- Revenue, owed and trend in one place
- Attended-but-unbilled work, valued
- Defensible to the invoice
Catch the drift before it costs you.
The advice engine runs more than fifty checks against your own history every night and surfaces what has moved, named, with the money attached. You hear about a slipping rebooking rate or a quiet week while you can still do something about it.
- Deviations from your own norm, not generic tips
- Named subjects and a money figure
- Quiet when things are fine
Know if it's you, or the whole sector.
A weekly read on the entire UK MSK market, so when a fortnight goes quiet you know whether it is your clinic or the season. No more staring at a soft month wondering if it is just you.
- Sector demand weekly, with a 12-month view for context
- NHS pressure, rates and search demand
- A plain written briefing
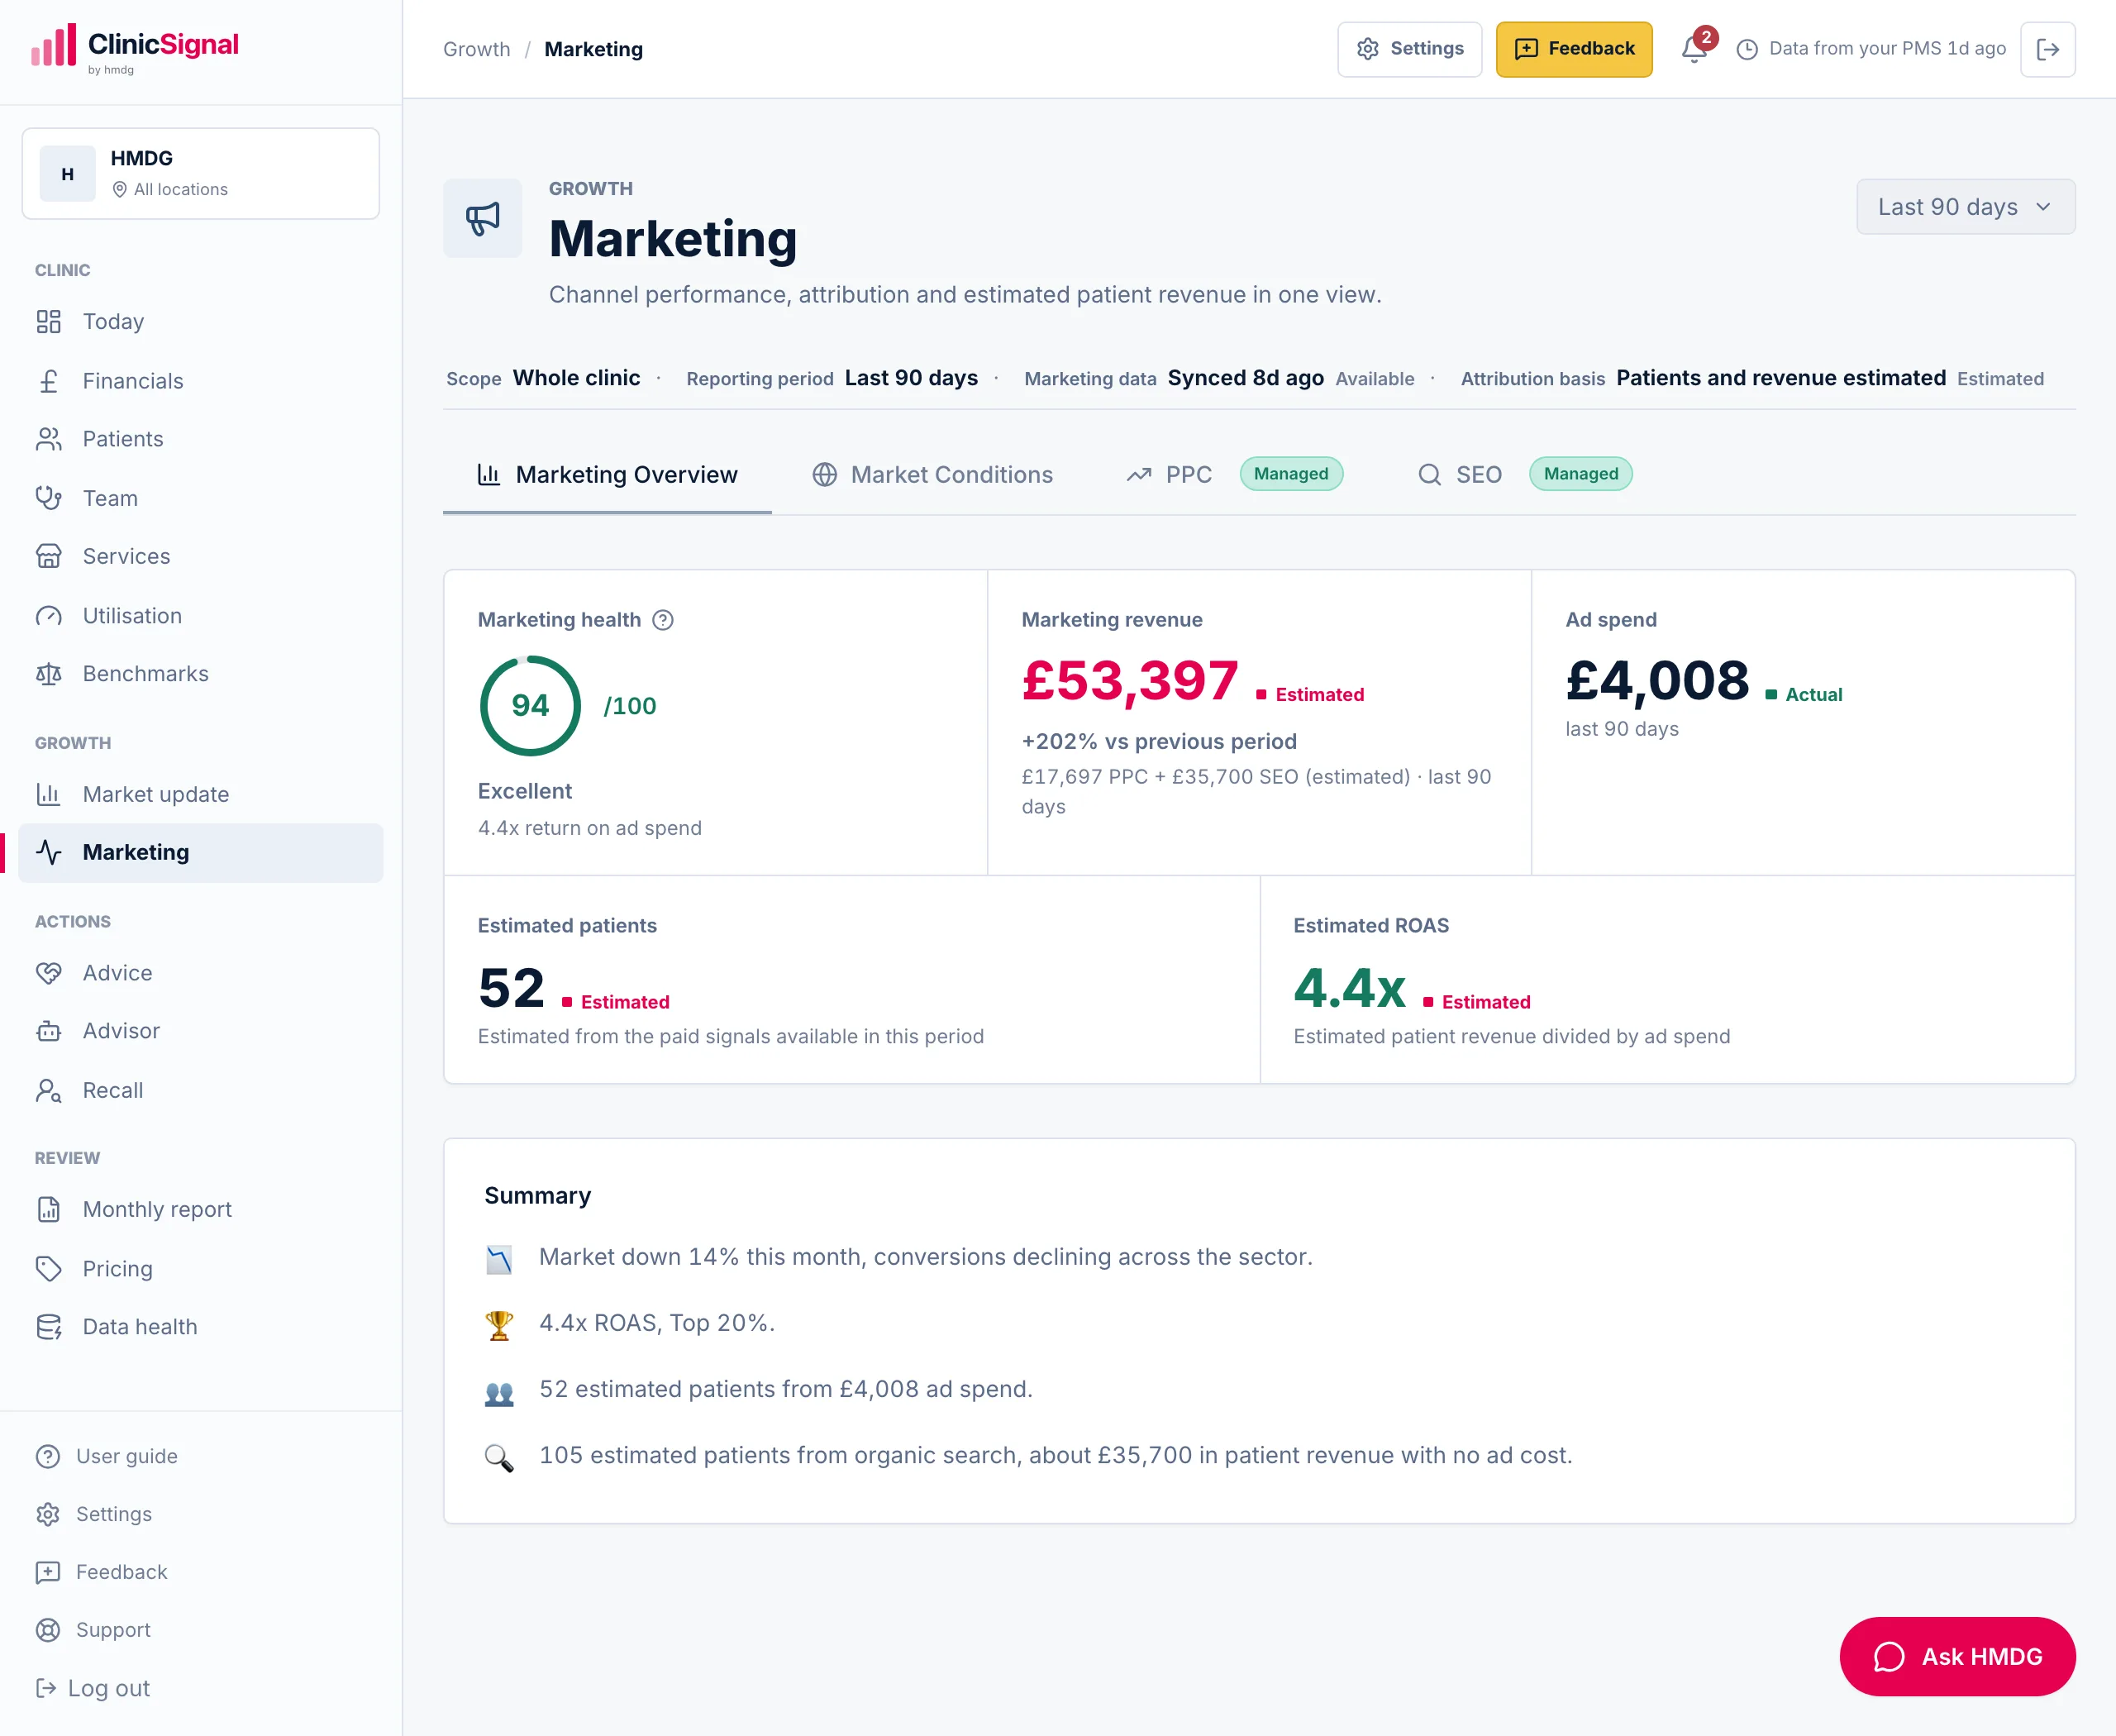
Measured against patients, not clicks.
Every marketing pound measured against real bookings and patient value in your PMS, with branded searches discounted honestly. You finally know what a patient actually cost and whether the spend paid for itself.
- Real return on ad spend and cost per patient
- Bookings from your PMS, not click estimates
- SEO and paid in one view
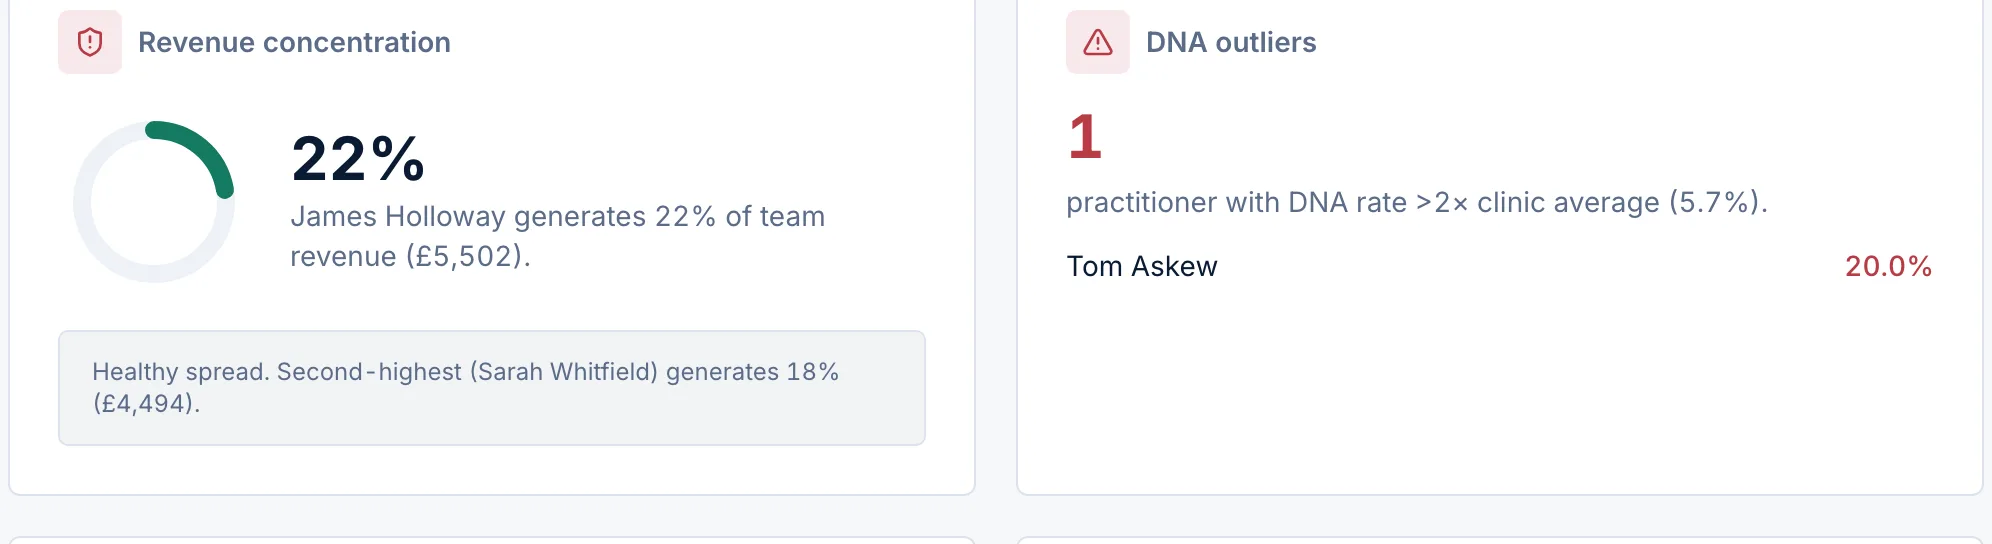
See the risk before it walks out the door.
How concentrated your revenue is on any one clinician, who is quietly carrying the month, and where rebooking and drop-off are slipping by practitioner. Key-person risk you can see and manage.
- Revenue concentration, flagged
- Caseload balance across the team
- Rebooking and follow-up by person
The revenue hiding in your list.
Patients who have gone quiet, ranked by what they were worth, checked live before every export so nobody who already rebooked makes the list. A recall your admin team can run into any quiet week.
- Warm, cooling and lapsed buckets, valued
- Live re-check on export
- Templates ready for your team