Features/Reports
Reports

Owner-ready,
always current.

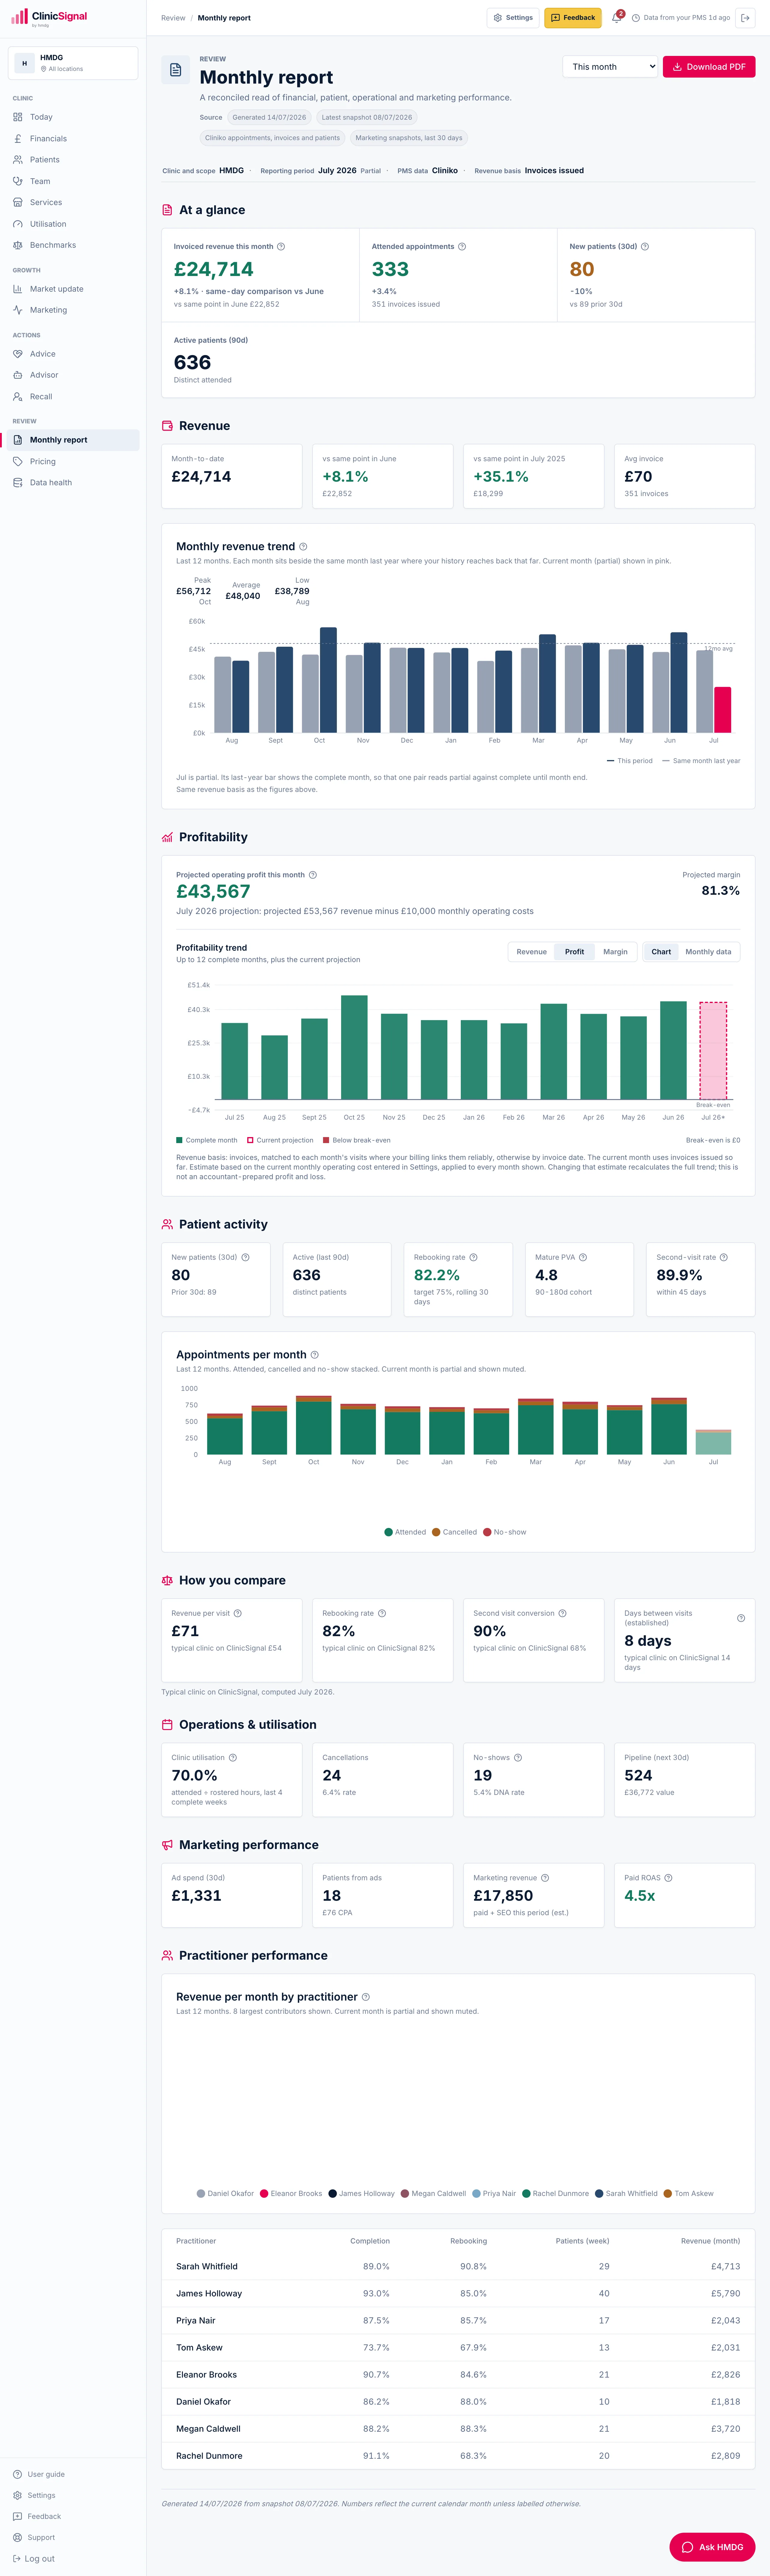
The completed month pulled together: revenue with year-on-year context, patient activity, operations, marketing and practitioner performance. Pick any month, print to PDF, share with a partner or your accountant.

/dashboard/reports
/dashboard/reports
01At a glance

One number, one delta each.

Clean glance tiles that each carry one number and one comparison, then balanced detail sections beneath.
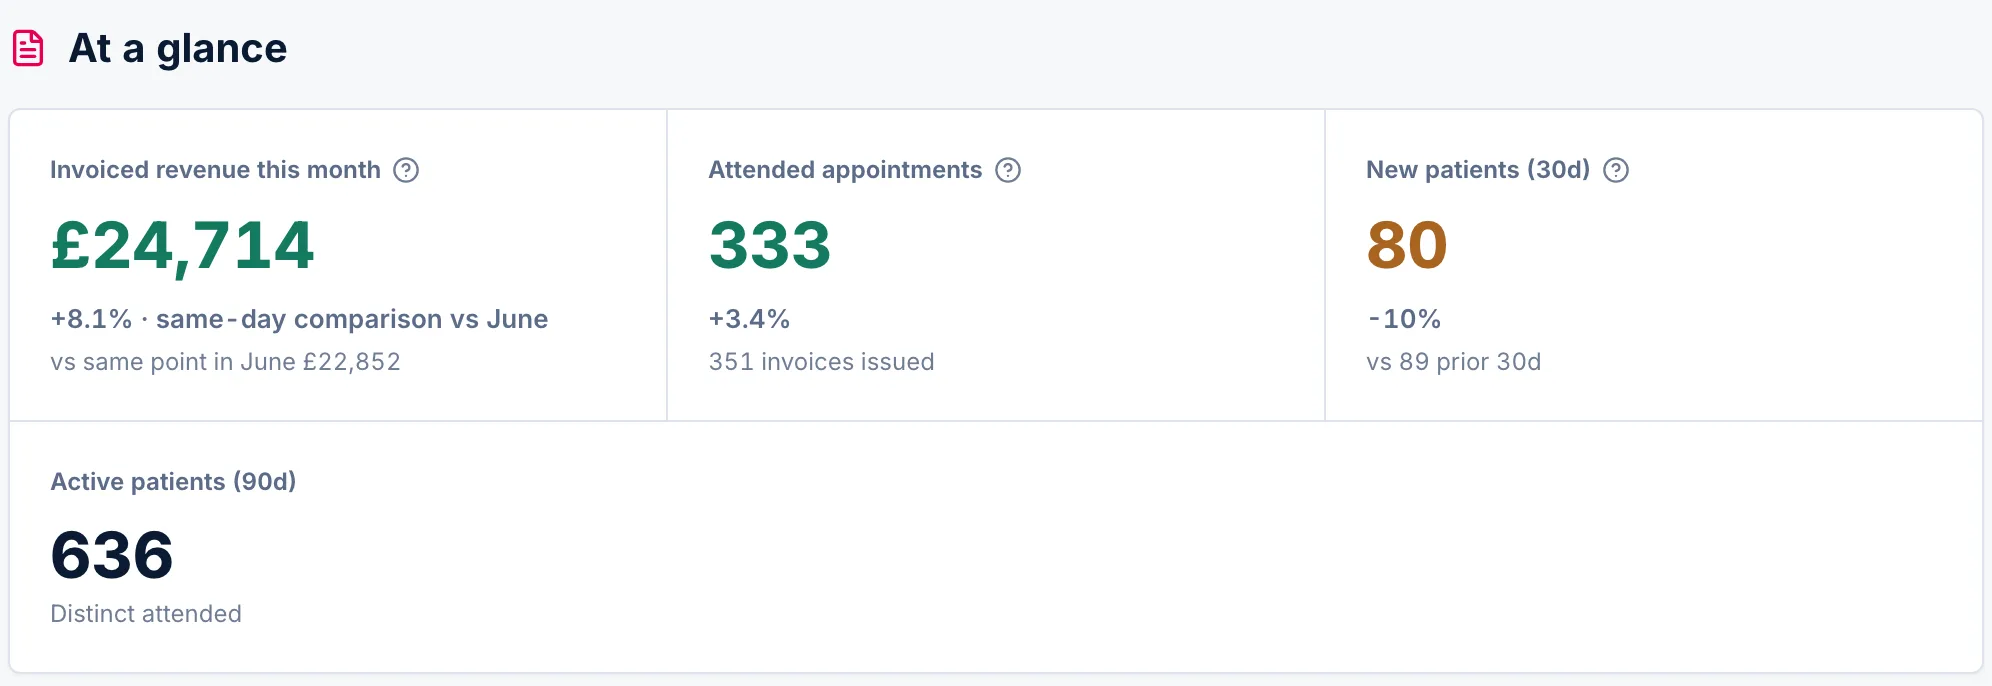
  • Glance tiles with a single clear delta
  • Month picker for any period on record
  • A partner PDF built to share outside the clinic
Monthly report · At a glance
02Revenue in context

The month against the year.

Revenue for the month with year-on-year context, on the same basis as the Financials tab.
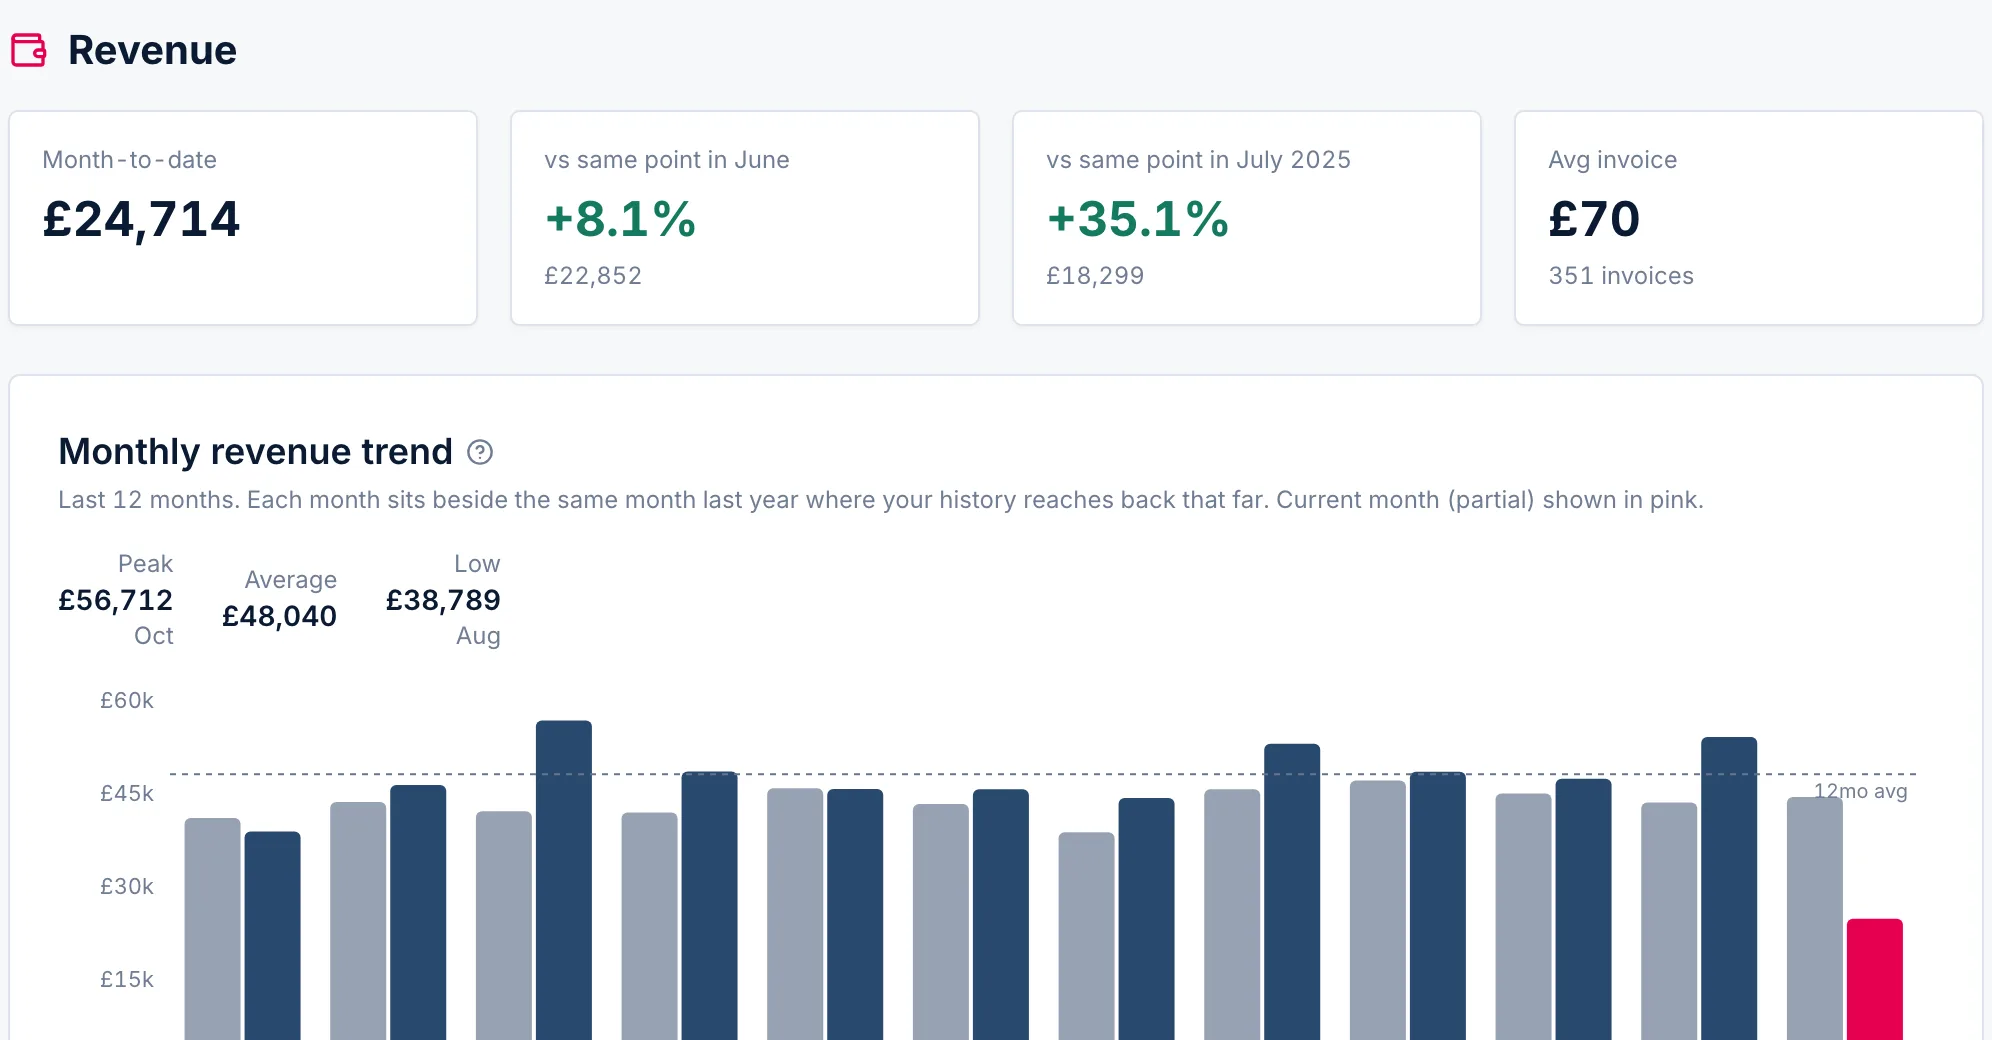
Monthly report · Revenue
03The revenue line

Twelve months, in the report.

The twelve-month revenue trend in the report itself, so the shared version tells the same story as the dashboard.
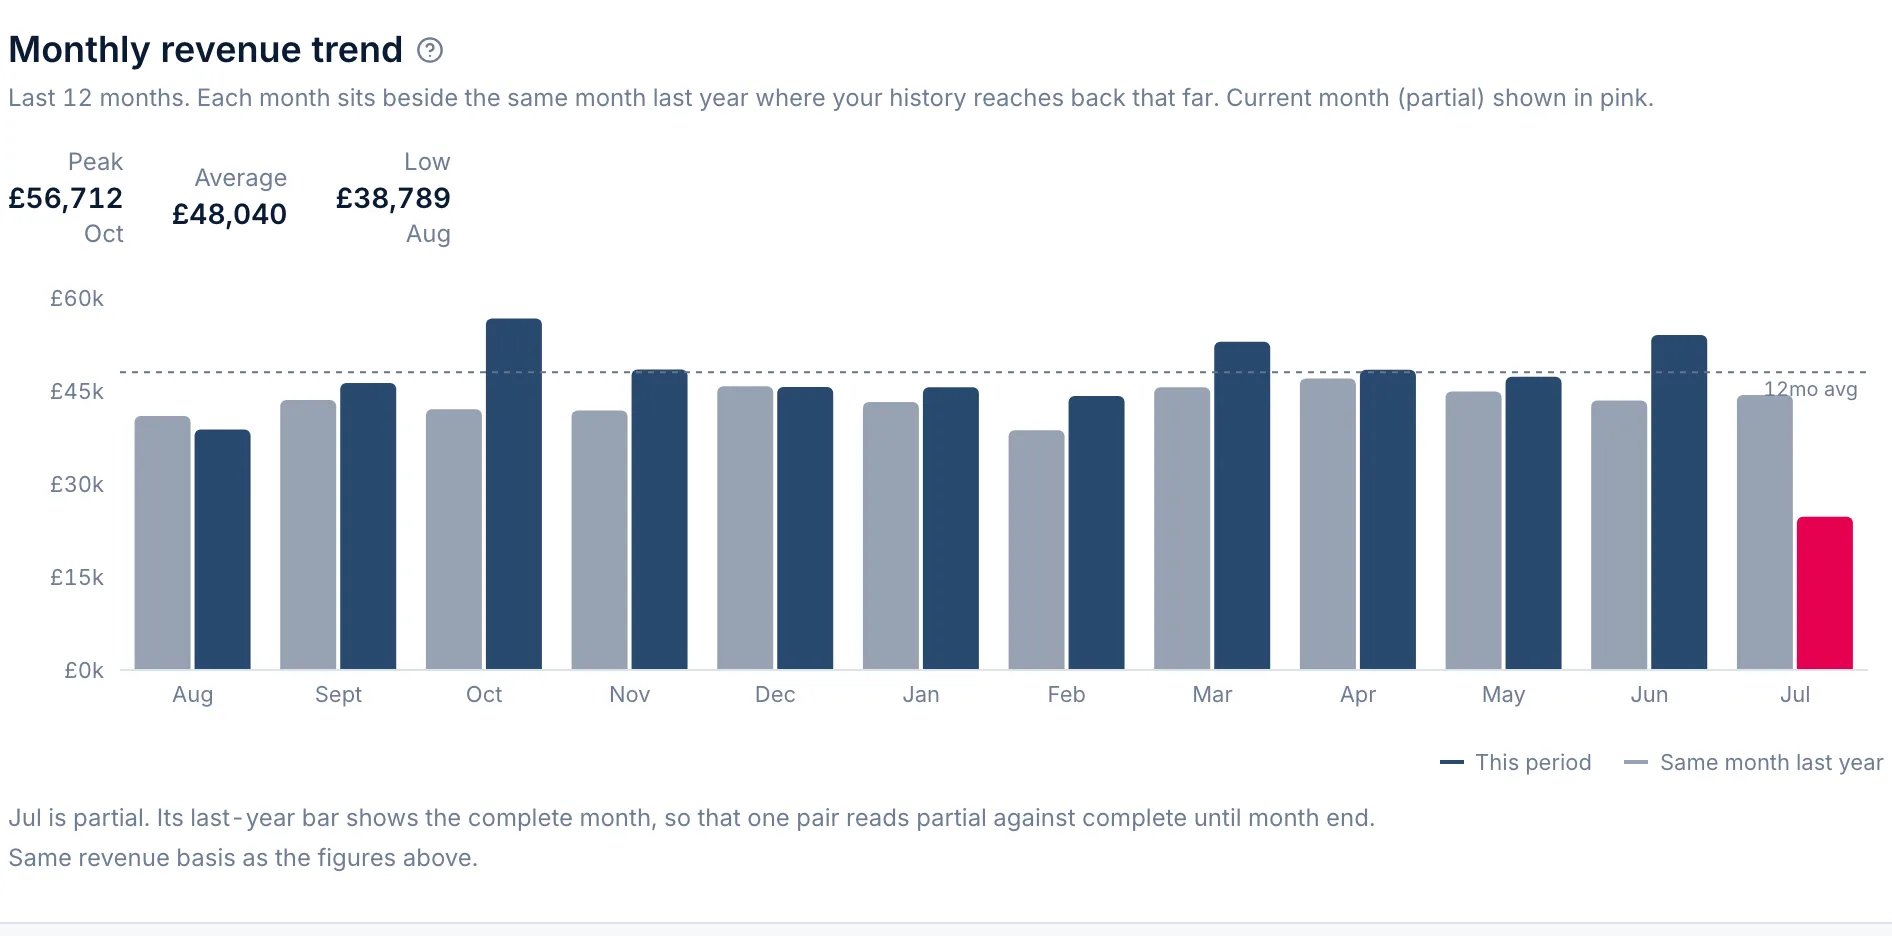
Monthly report · Monthly revenue trend
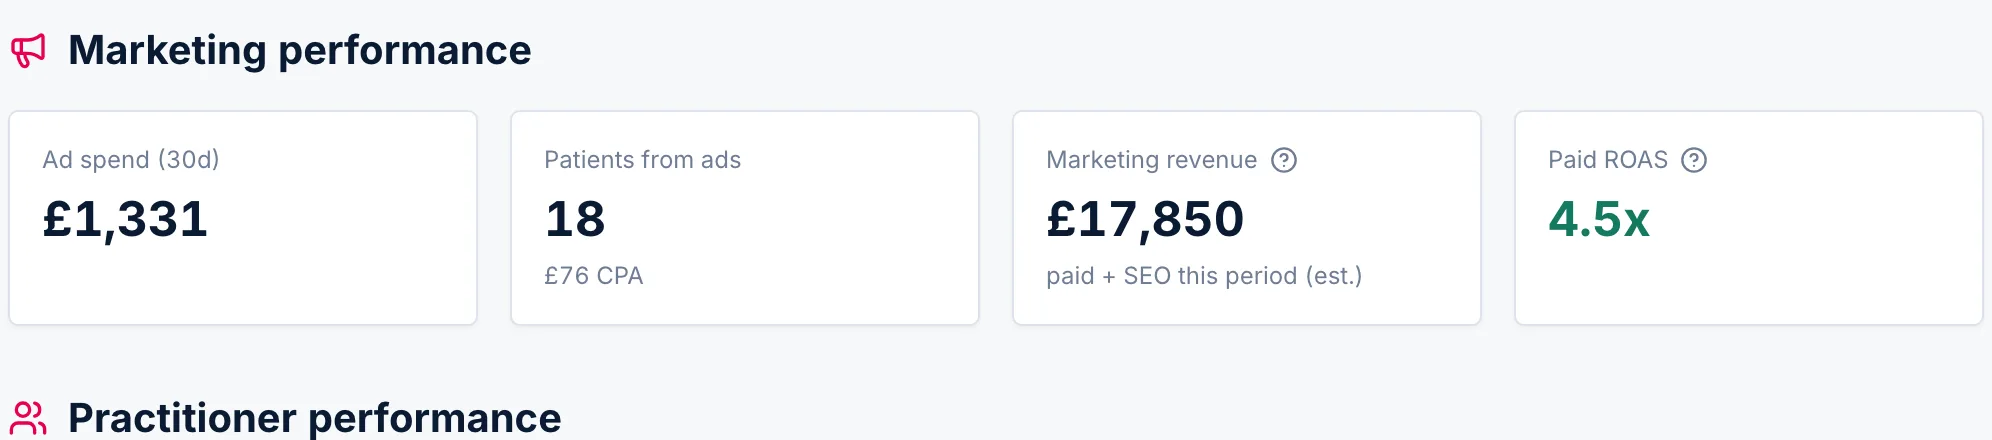
04Marketing performance

The month's return, summarised.

The month's marketing return summarised for the report, ready to share without opening the live marketing tab.
Monthly report · Marketing performance
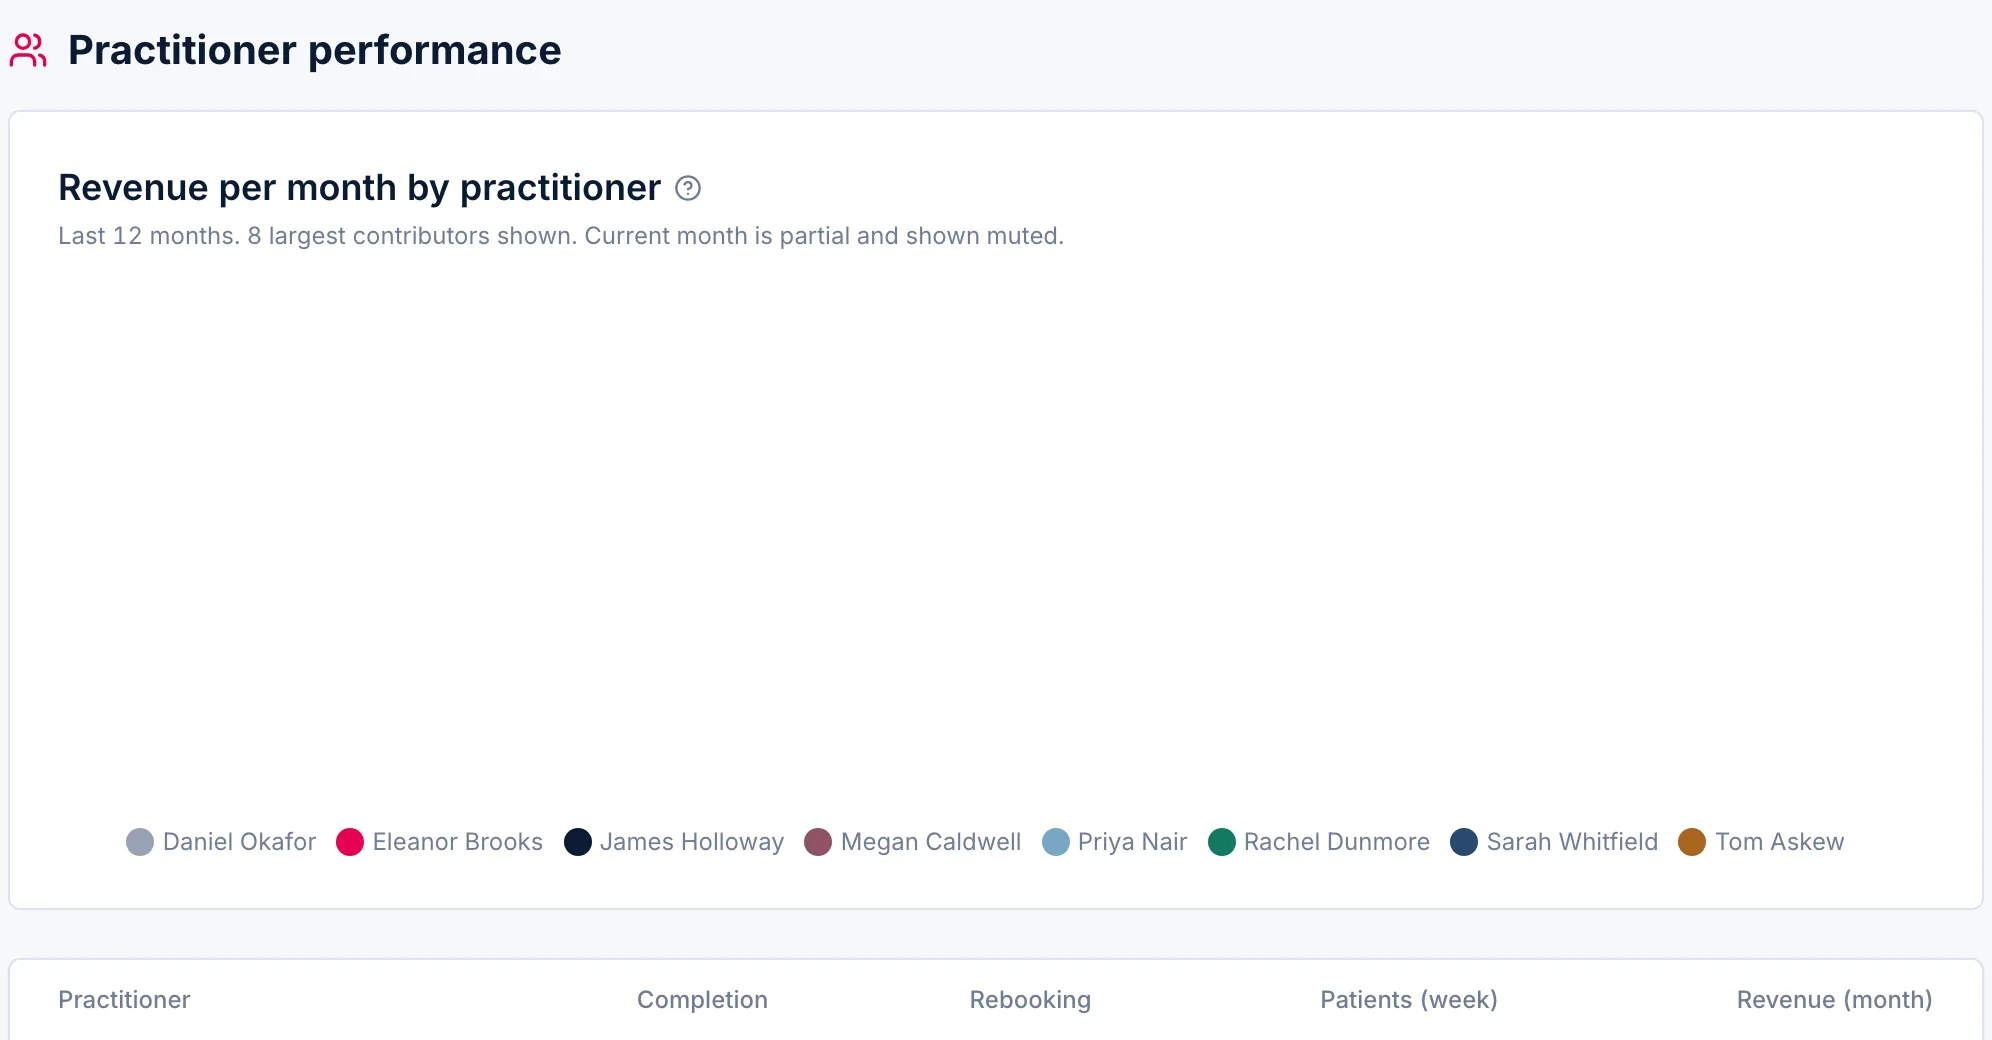
05Practitioner performance

The team's month.

Revenue and activity by practitioner for the completed month, ready for a one-to-one or a partner.
Monthly report · Practitioner performance
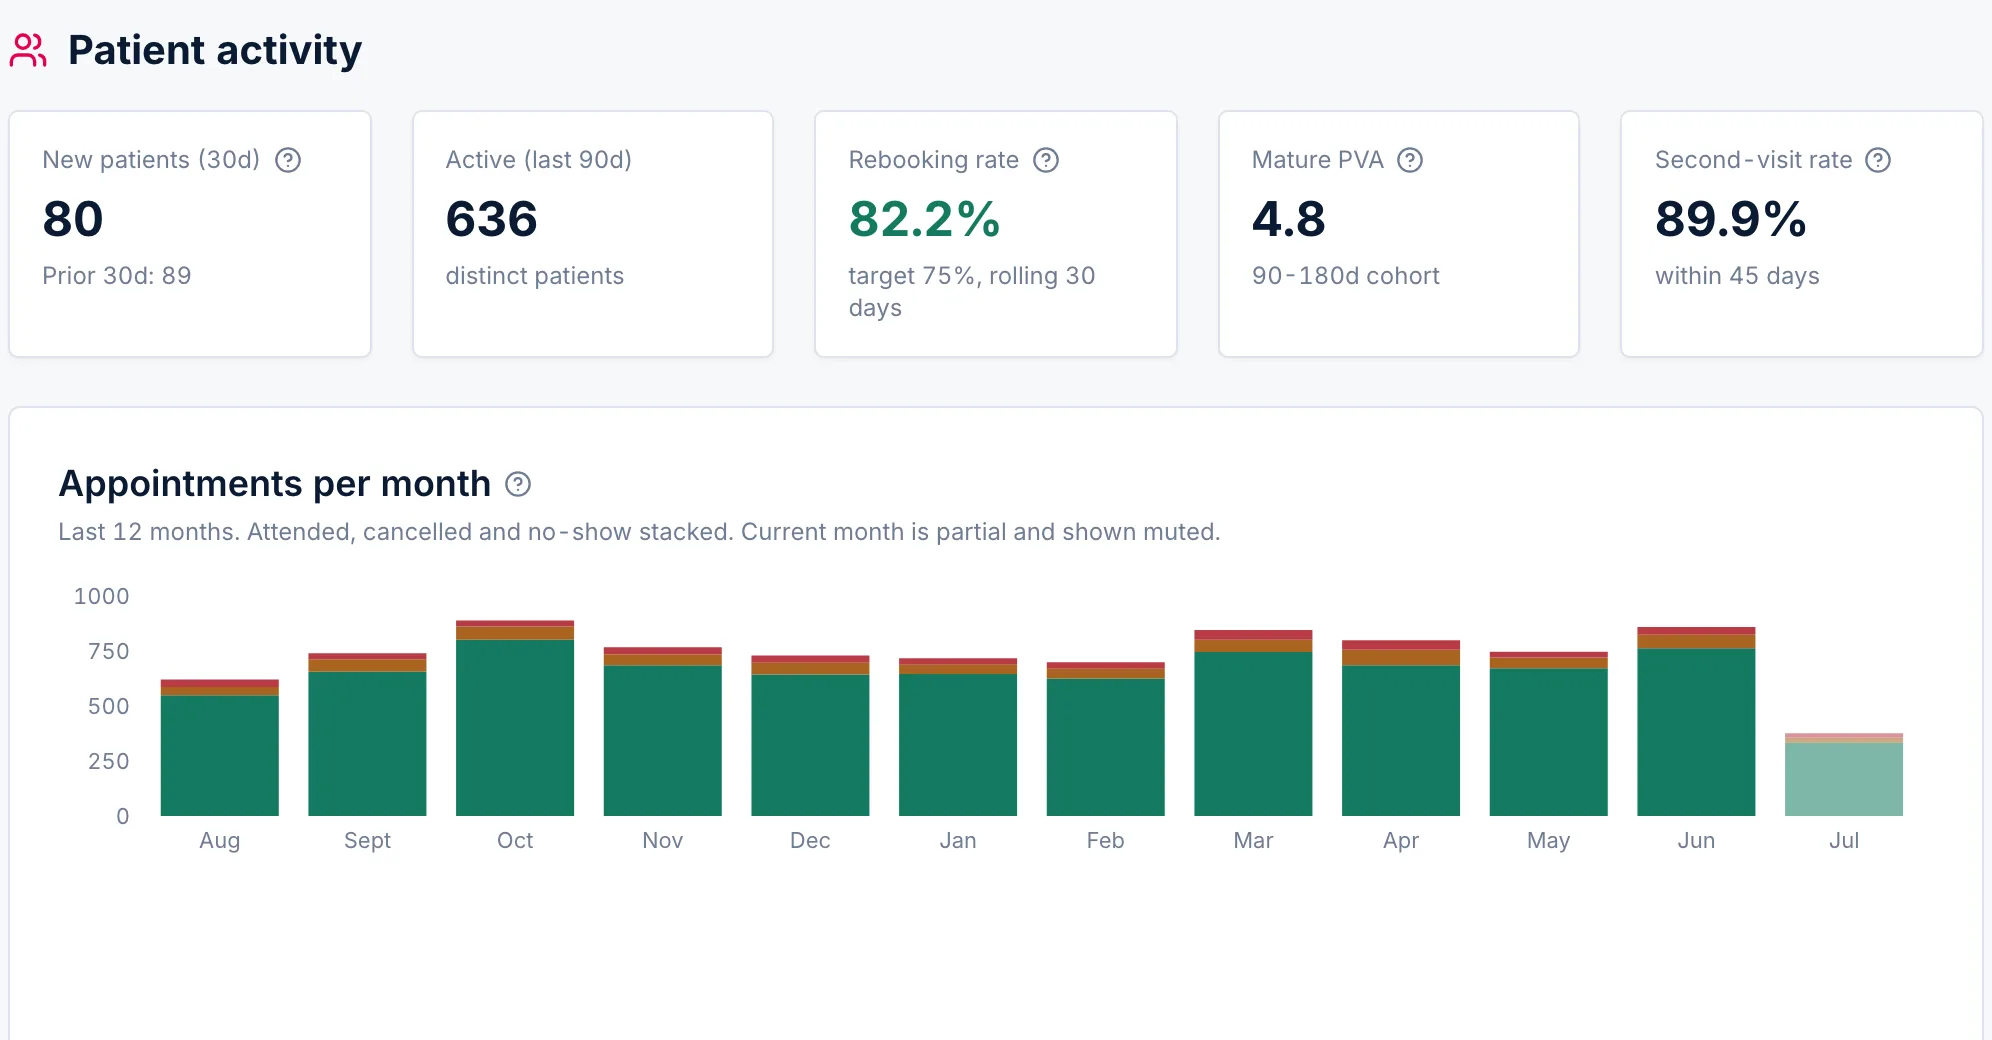
06Patient activity

This month, in patients.

New patients, attendance and rebooking for the completed month, ready to share.
Monthly report · Patient activity
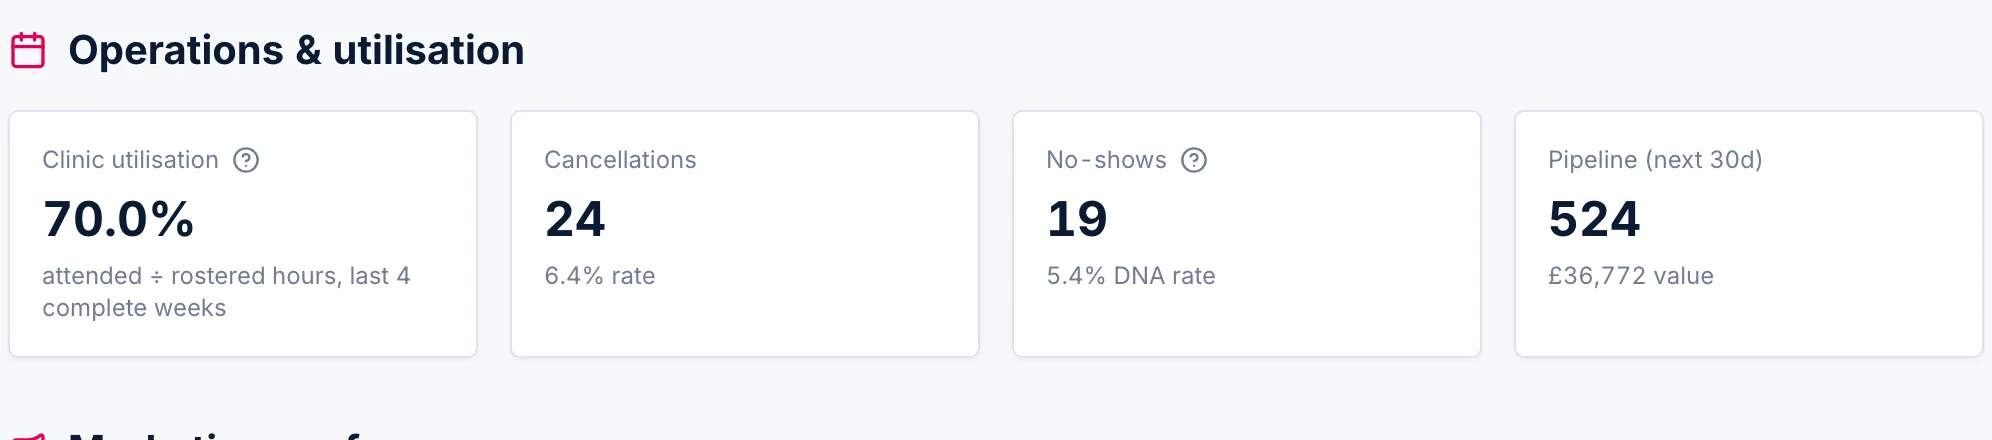
07Operations and utilisation

How full the month ran.

Utilisation, cancellations and no-shows for the month, in the report itself.
Monthly report · Operations
How it is worked out

The numbers behind it.

The report reads from the same snapshot as the dashboard, so the numbers always agree. Revenue carries year-on-year context on the same basis as Financials, a How you compare block carries the typical-clinic medians from the Benchmarks tab, marketing uses the same estimation as the marketing pages, and the partner version is laid out to be shared with someone outside the clinic. On the first Monday of each month the completed report is emailed automatically.
Where it shows up

It travels with you.

The monthly report shares its figures with Financials and the monthly email, so the story is identical wherever you read it.
Keep exploring
EmailsThe report in your inboxFinancialsThe same revenue, in depthOverviewThe month at a glance

See your month, owner-ready.

One report, always current, ready to share.

Sign up → Start free trial