/dashboard · Financials
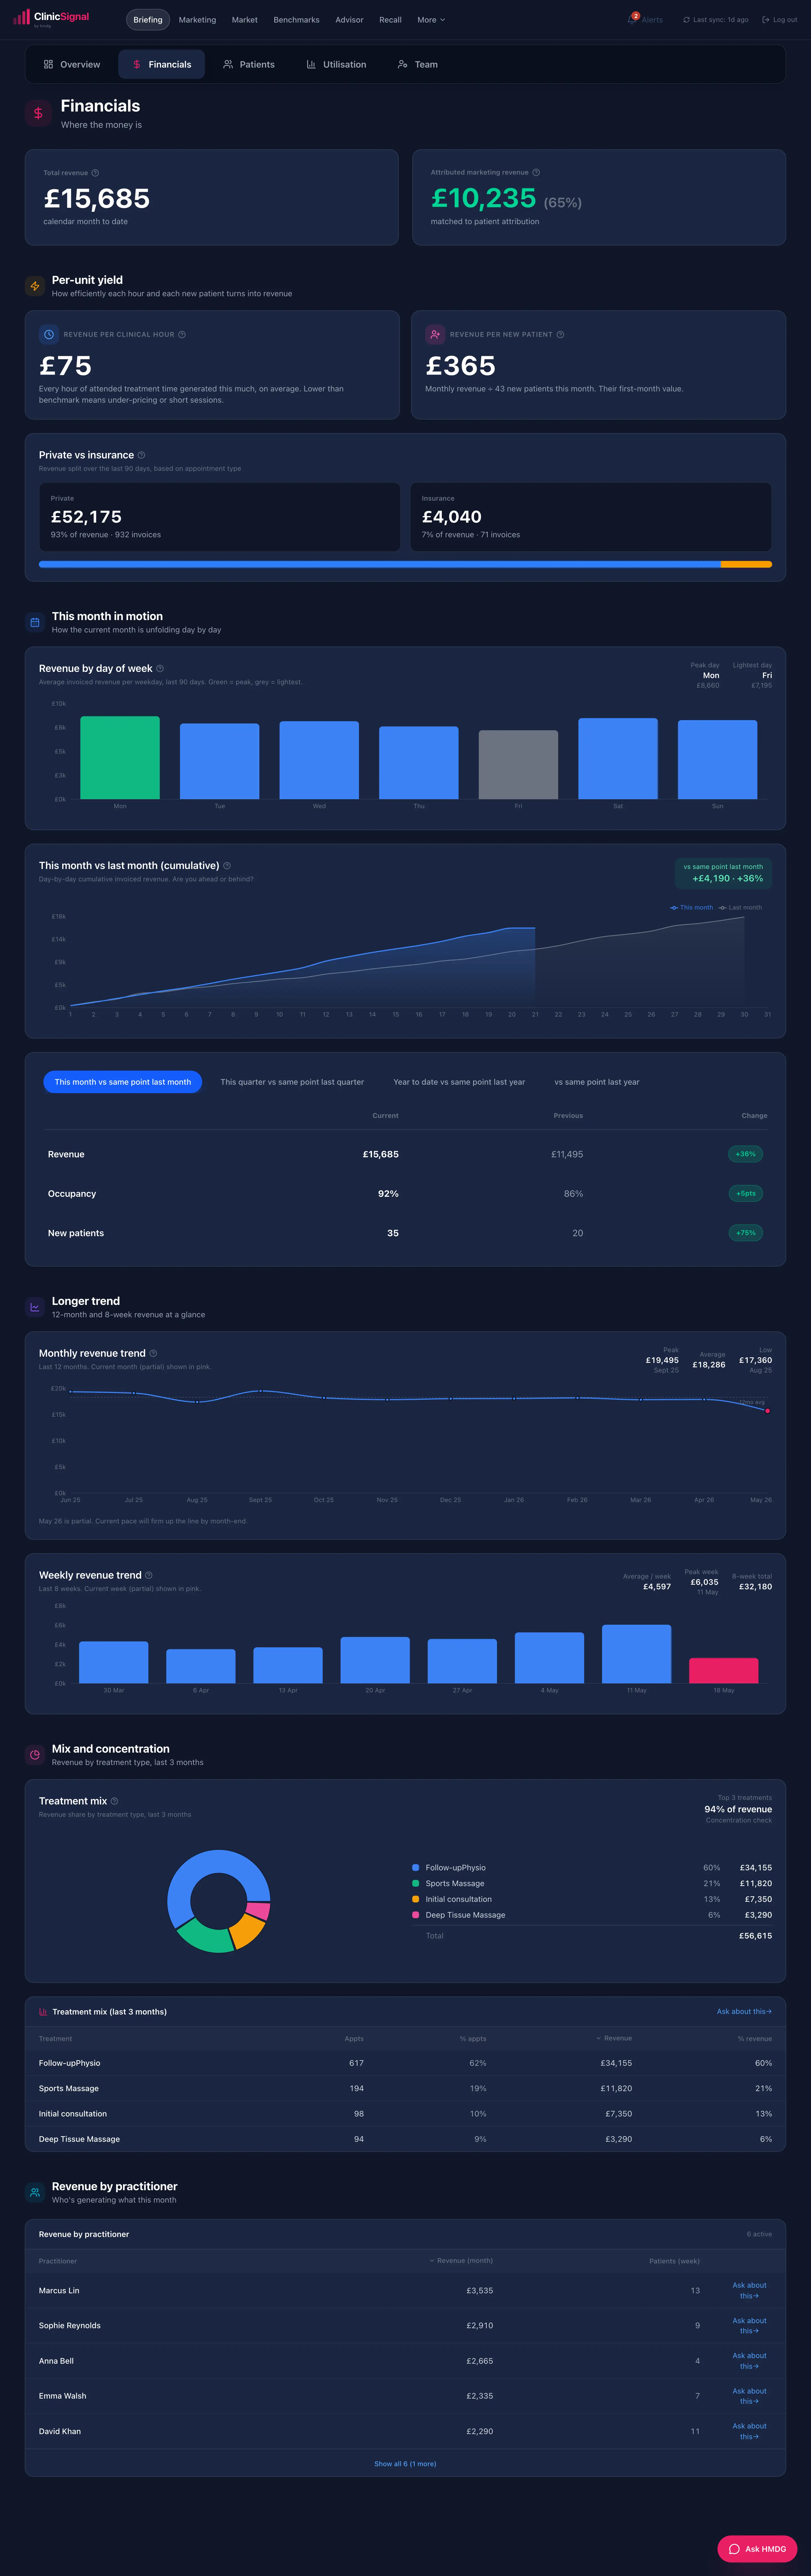
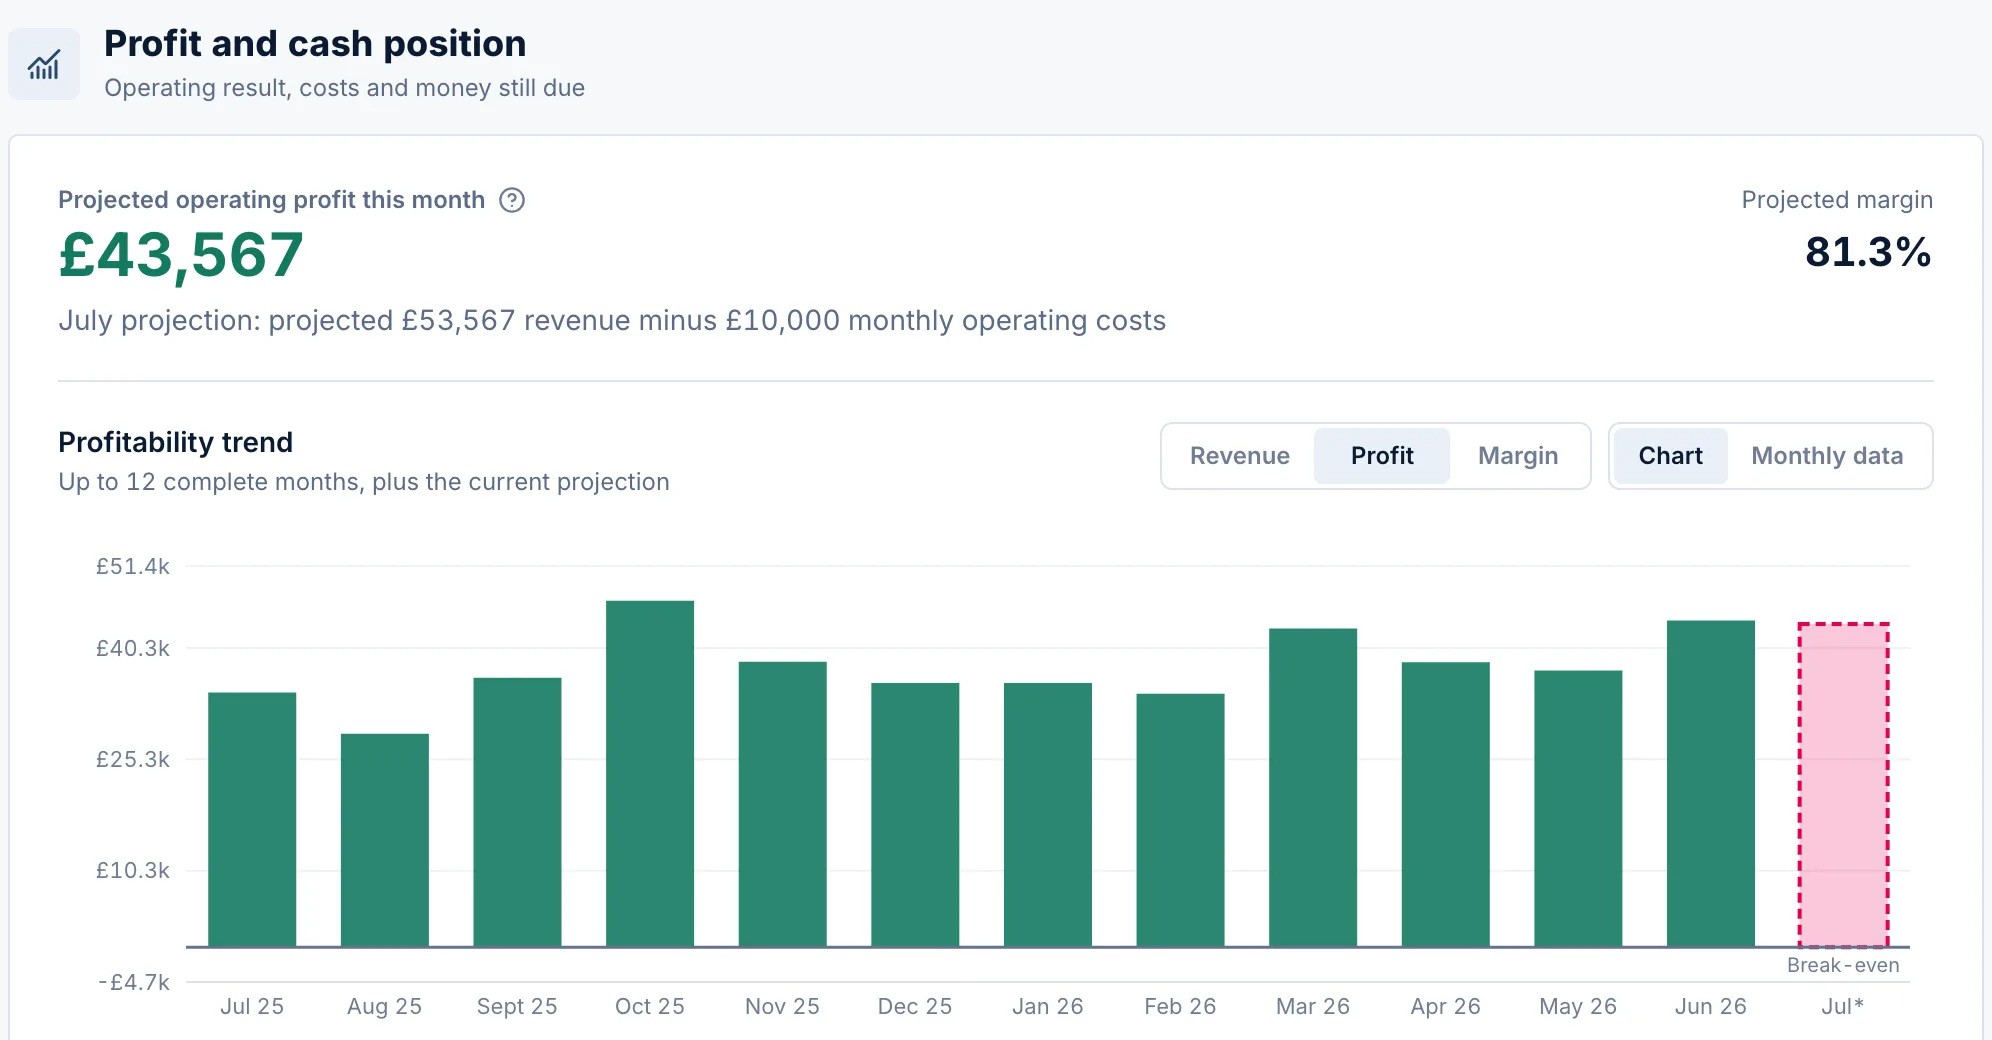
Revenue in full: year to date against last year, the monthly trend, the money owed to you, per-unit yield, and the quiet leaks most owners never get to see. All on your clinic's own billing basis, defensible to the invoice.
Outstanding invoices bucketed by age plus attended-but-unbilled work, the single biggest fast pot of recoverable revenue and usually invisible in the PMS.
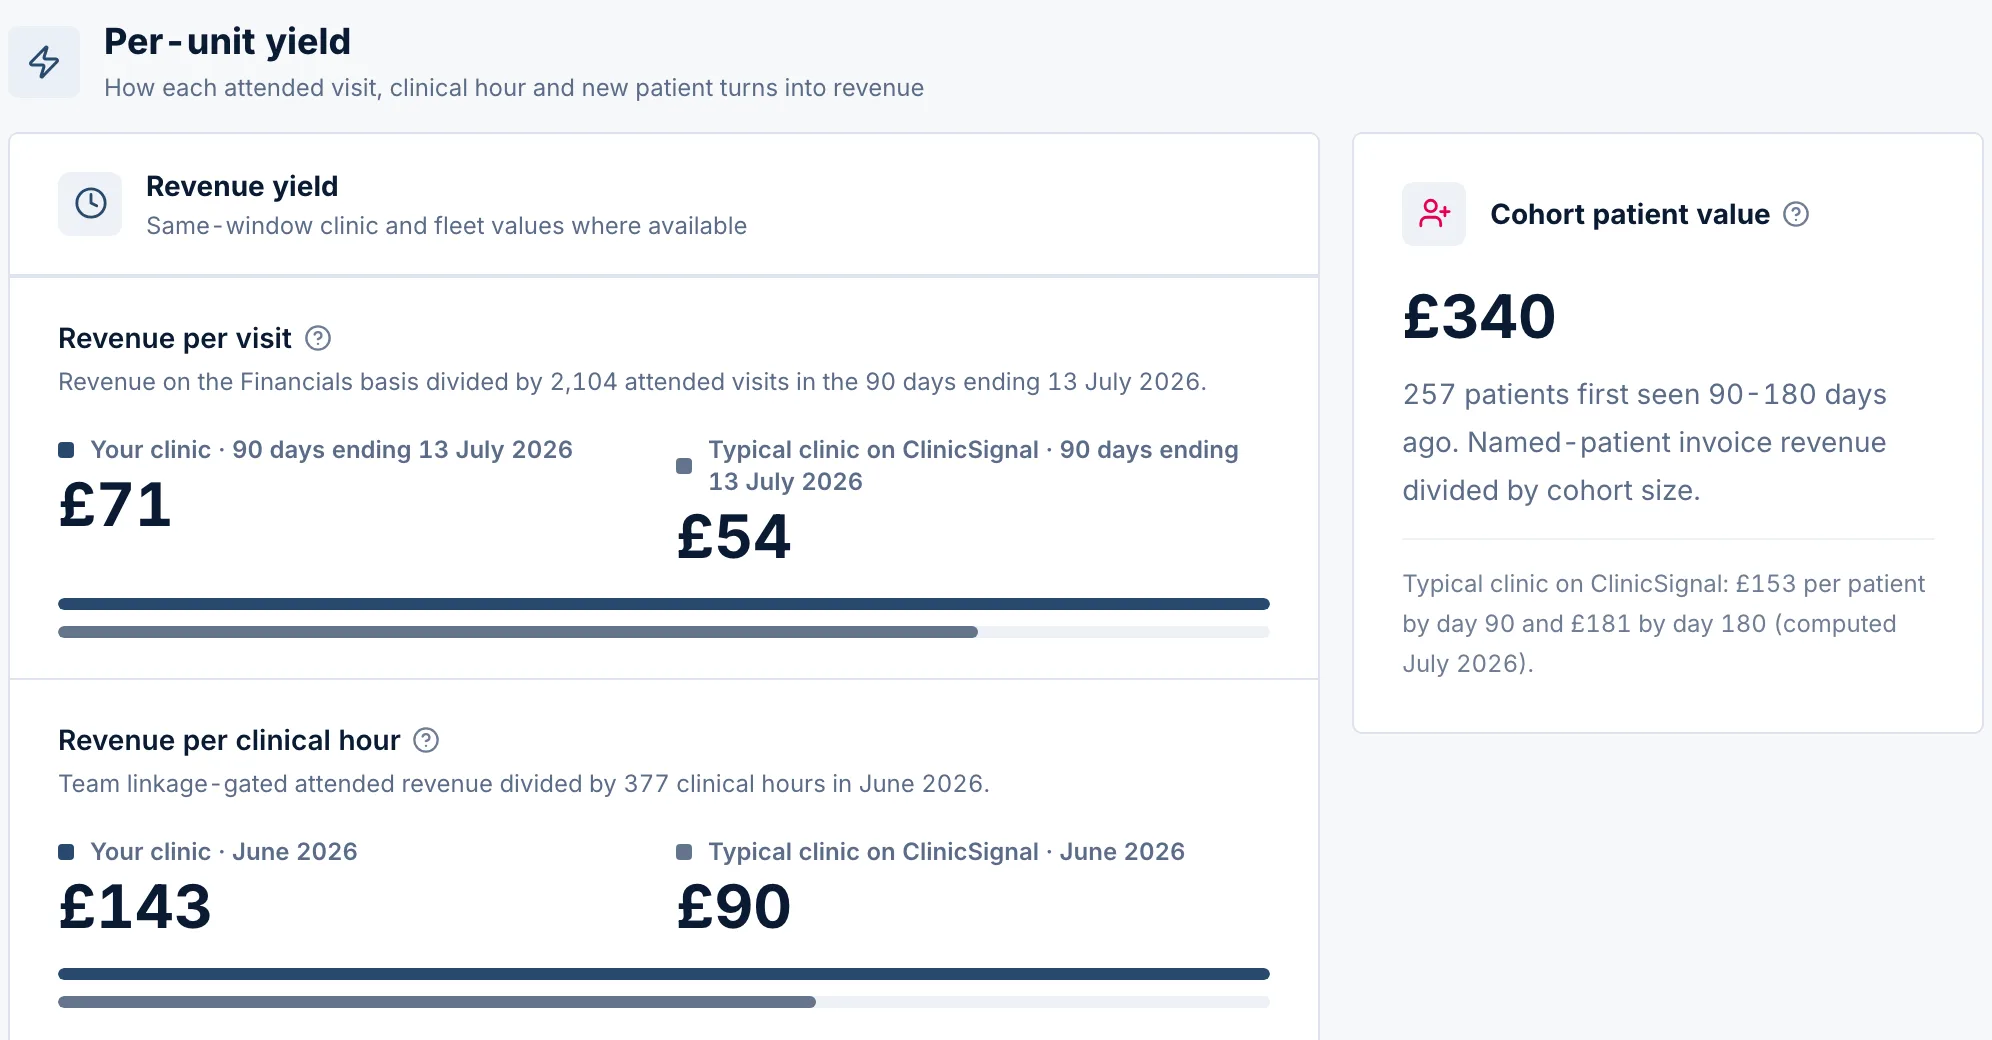
Revenue per clinical hour and per visit, so you can see whether a busy diary is actually a profitable one.
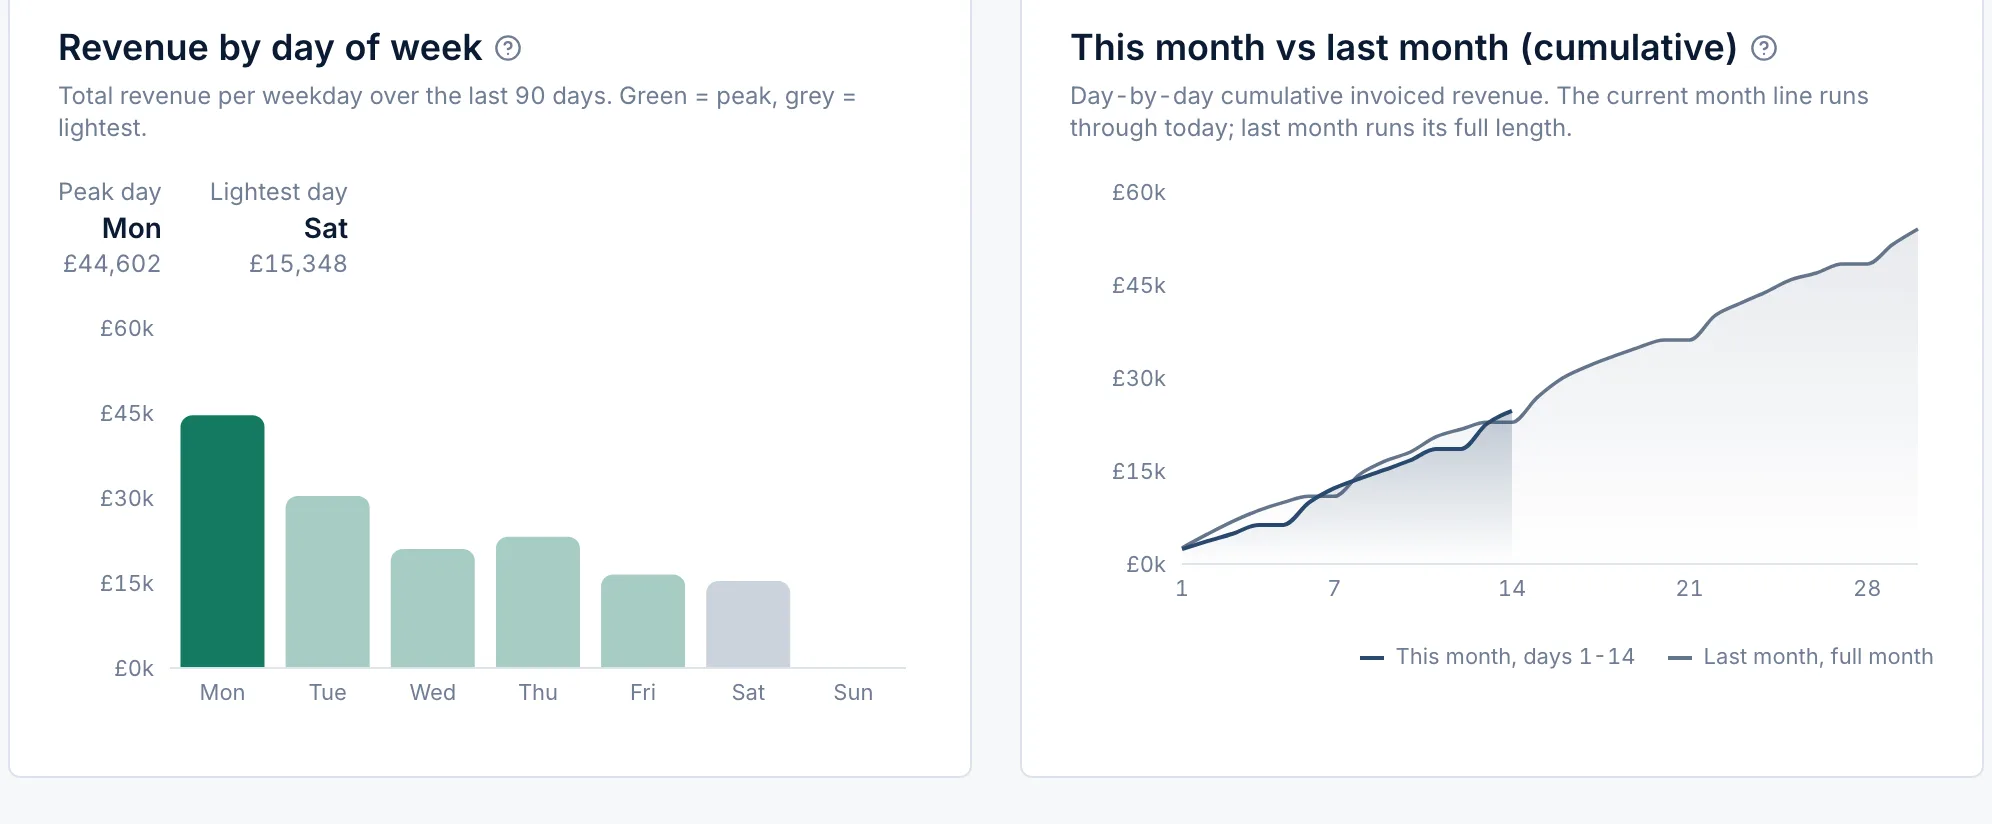
Revenue by day of week over the period, so you can staff to where the money really comes from.
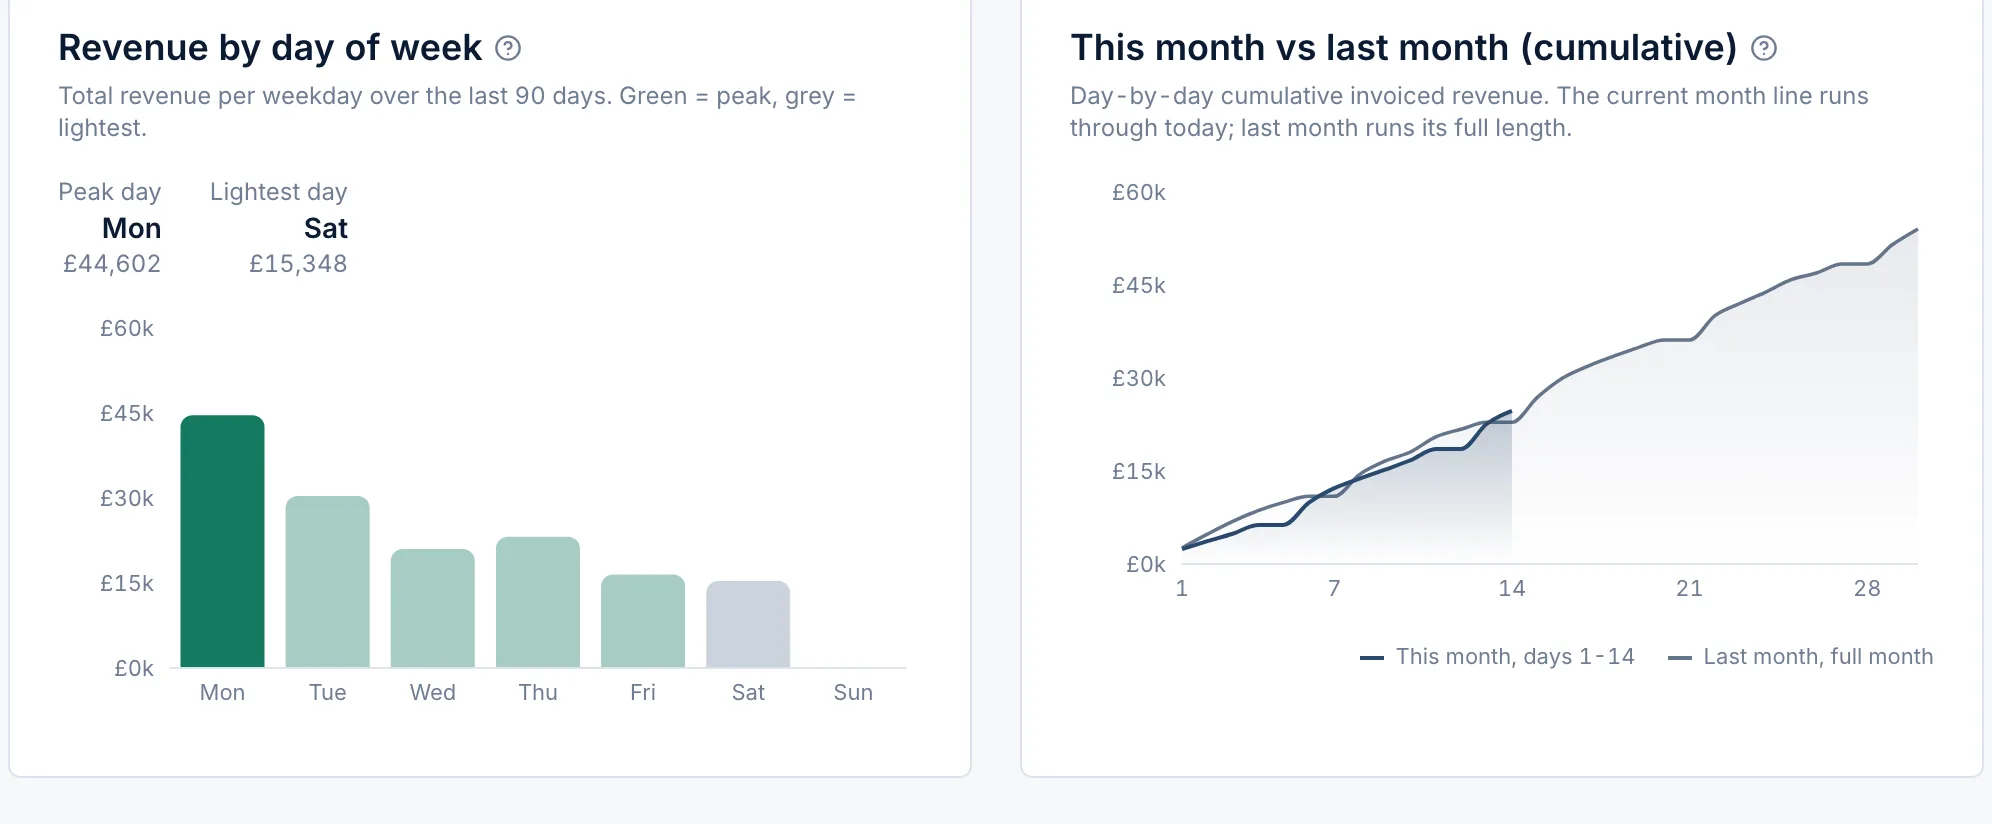
Cumulative revenue this month plotted against the same run last month, day by day.
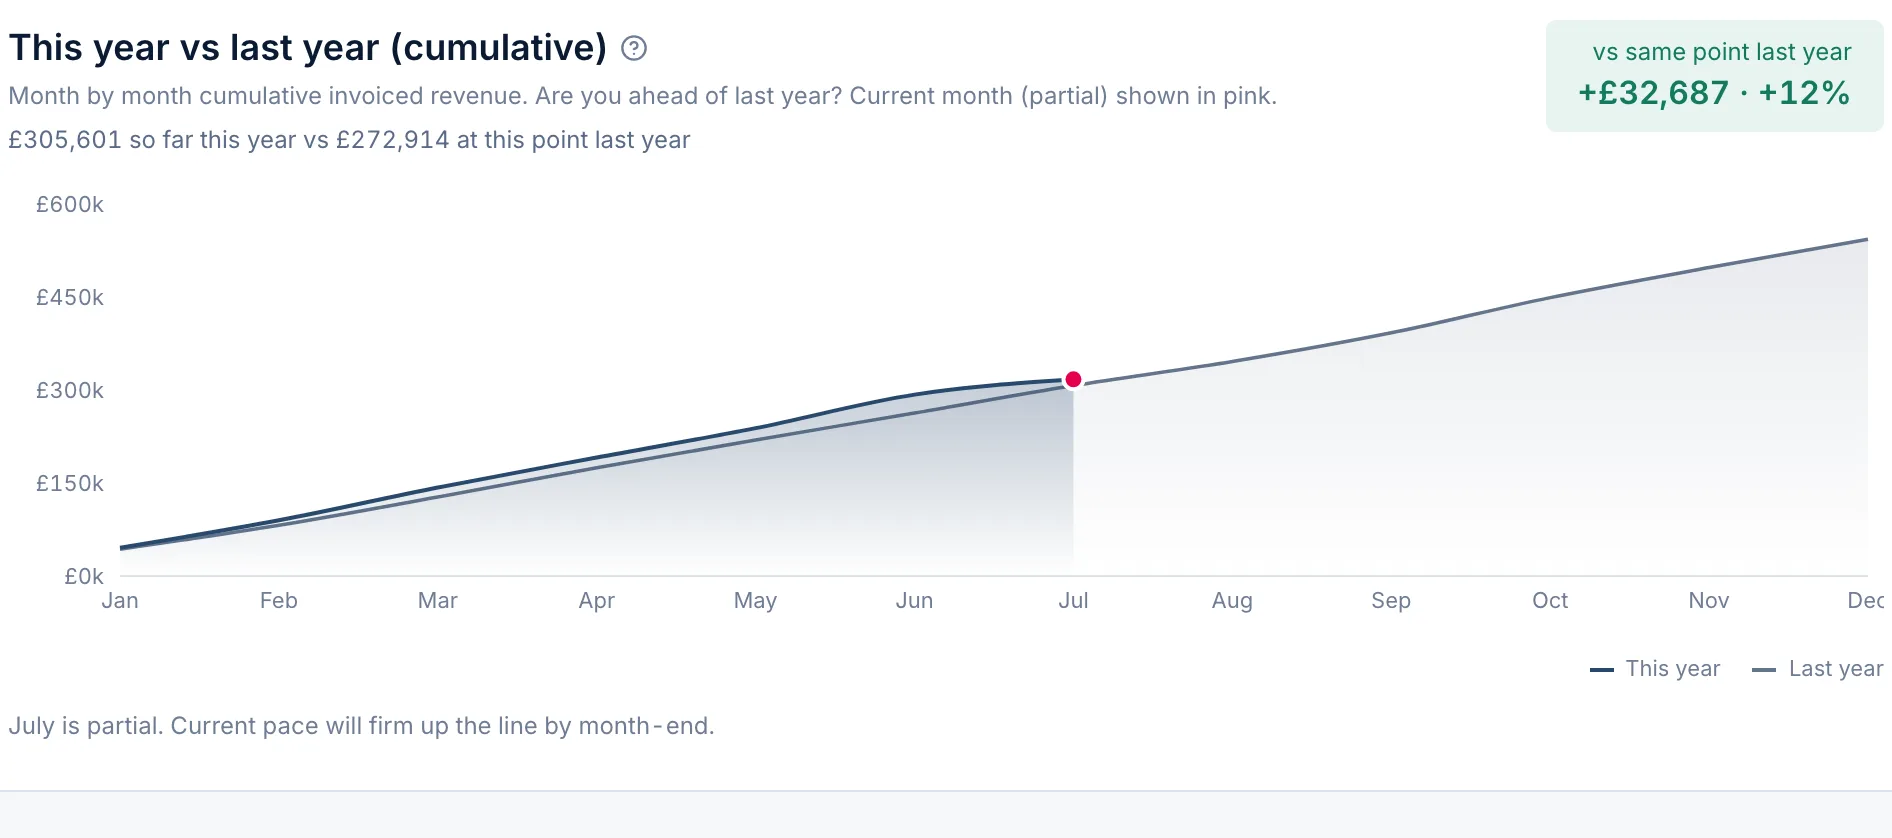
Cumulative revenue this year against the same point last year, on complete data.
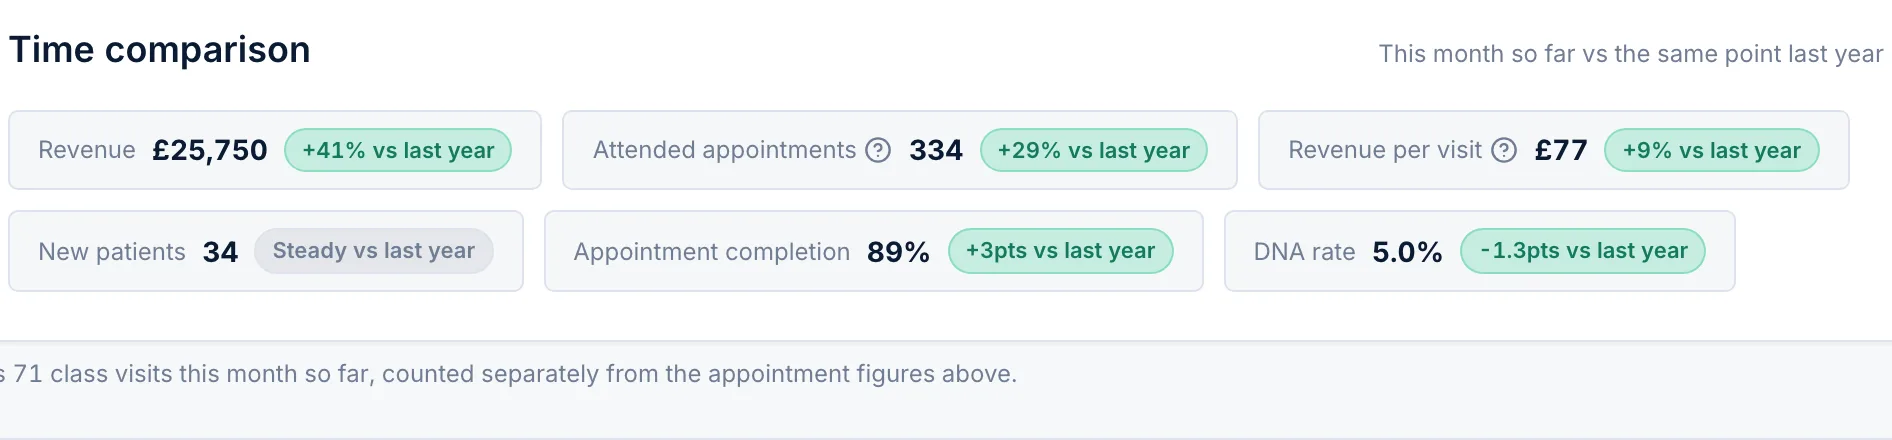
Revenue, attended, new patients, revenue per visit, completion and DNA as a year-on-year change over twelve complete months, one switchable chart.
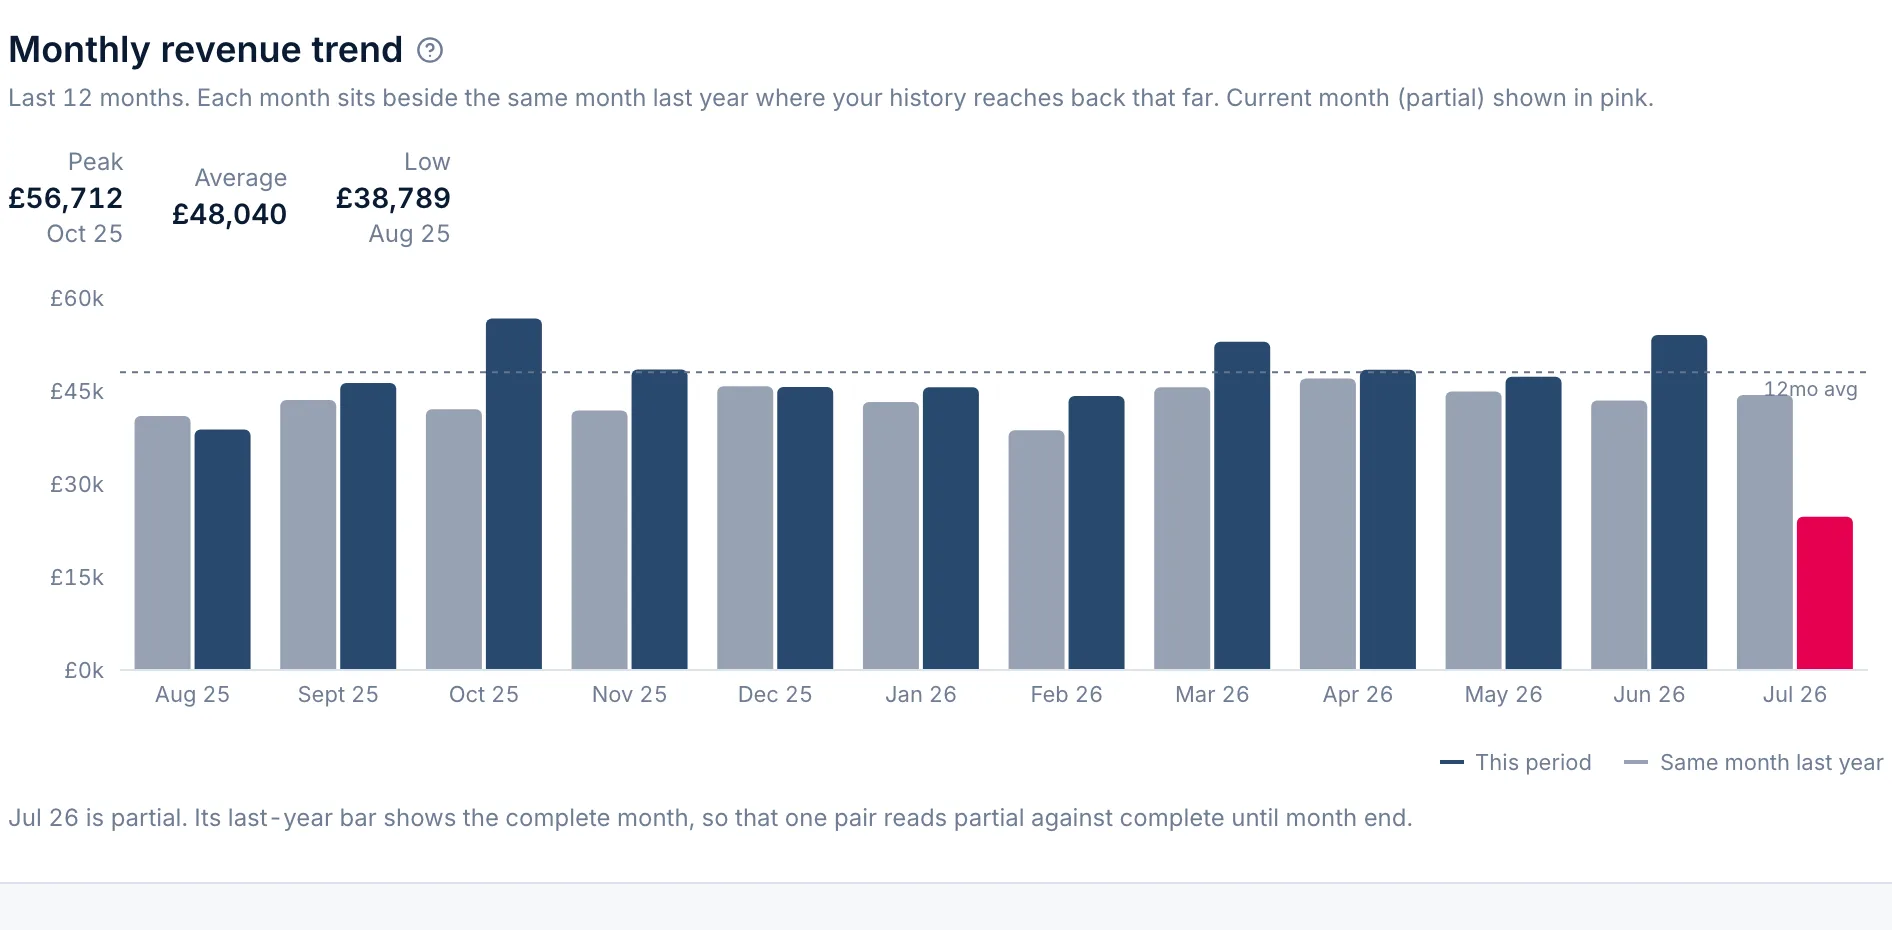
Twelve months of revenue with the peak, average and low called out, the current partial month in pink so it never reads as a real drop.
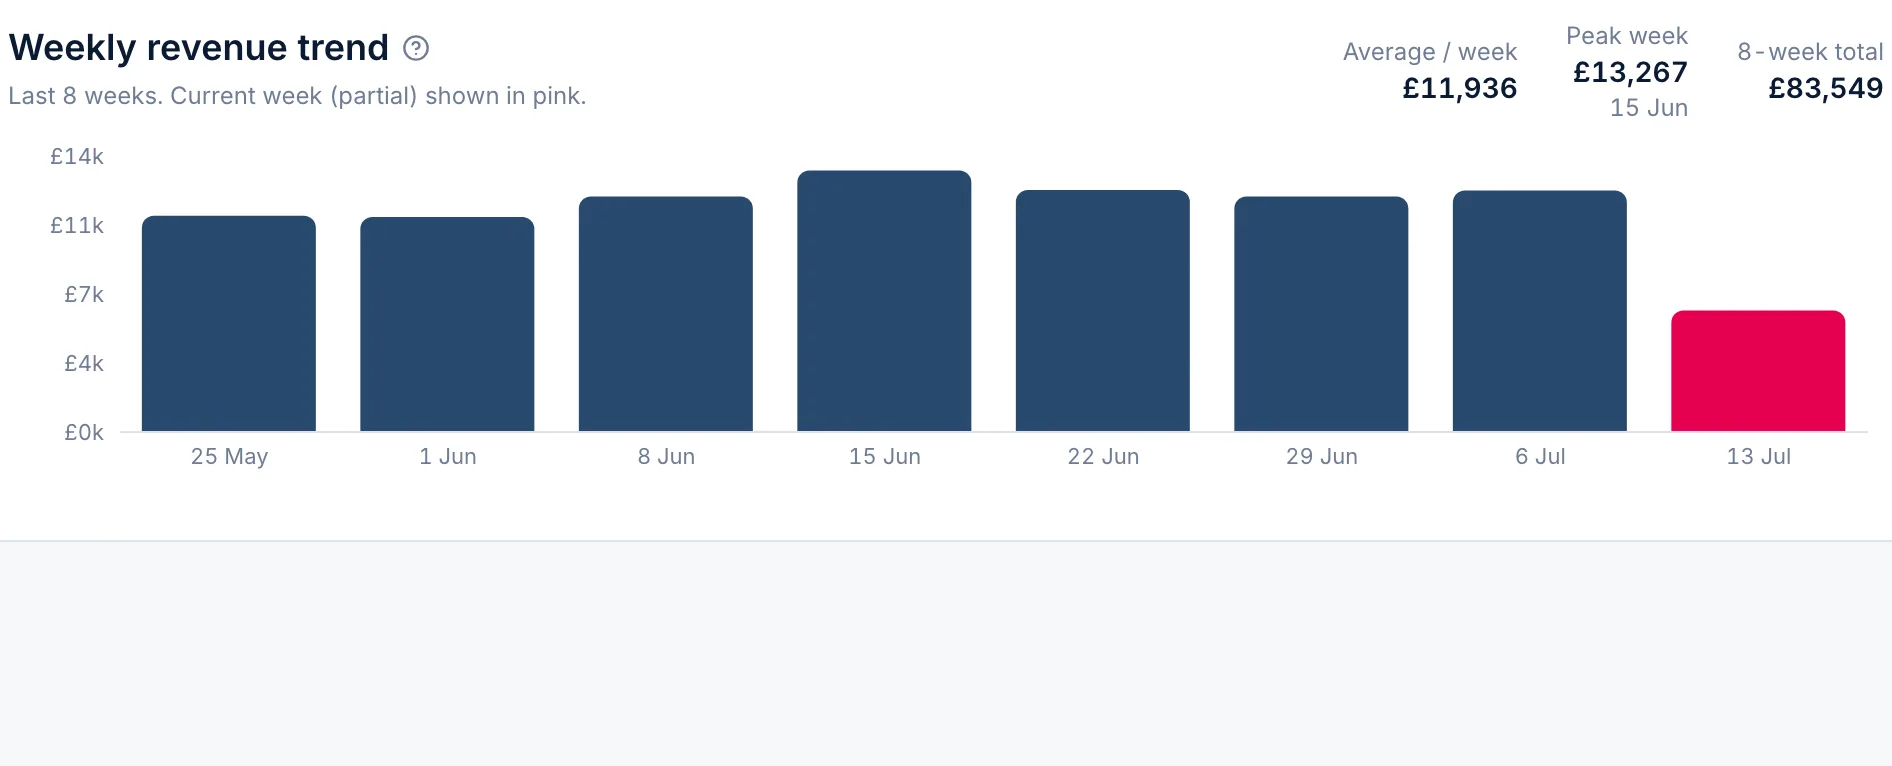
The last eight weeks with the average, peak week and eight-week total, the resolution you actually manage the clinic at.
Revenue, owed, yield and trend, defensible to the invoice.