/dashboard · Team
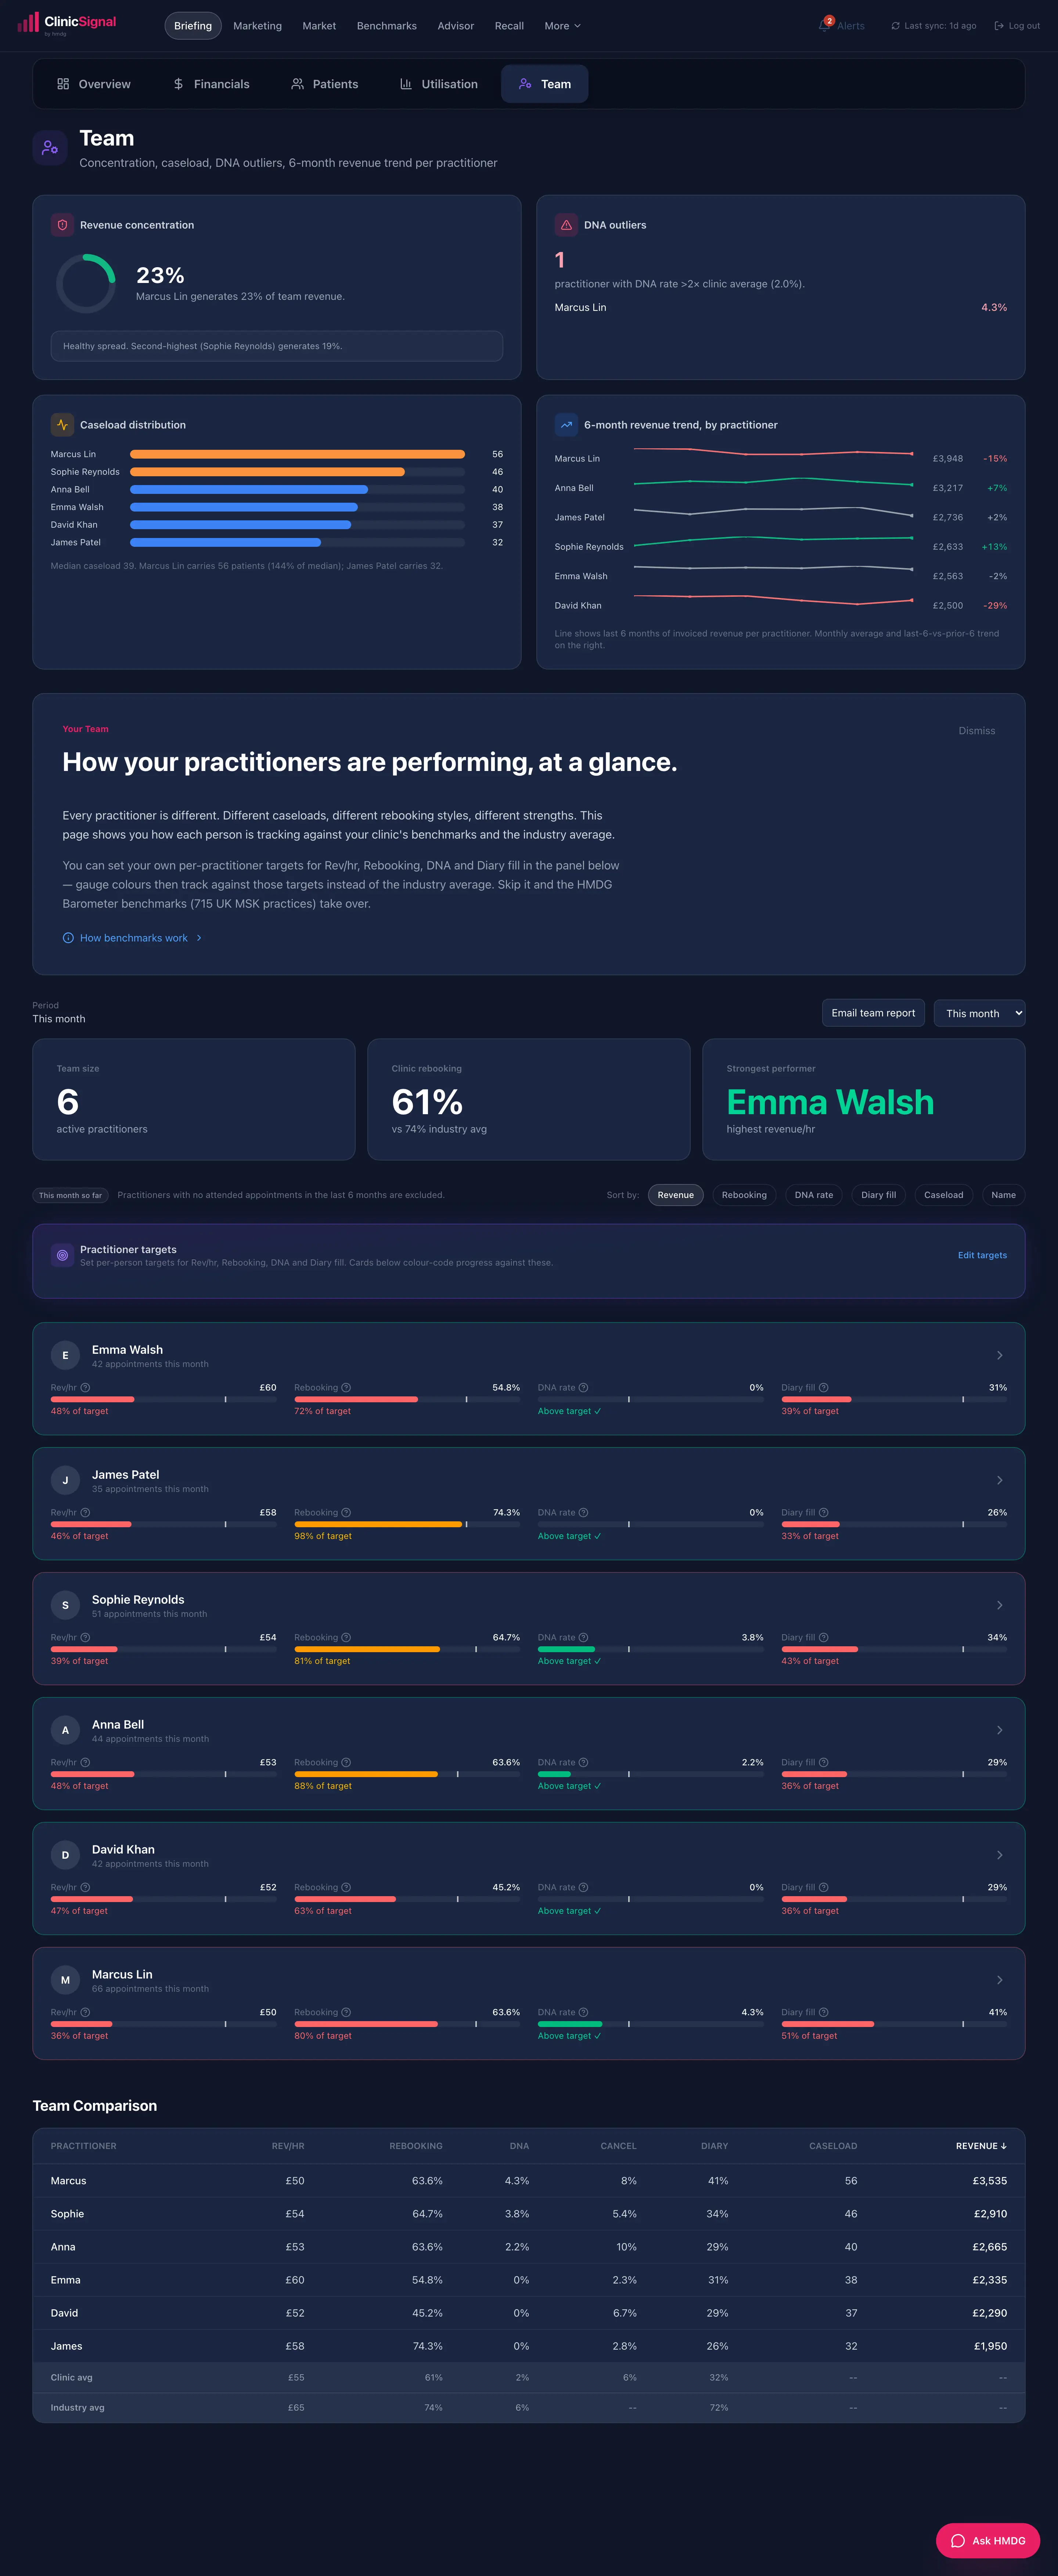
How each person is really tracking: revenue per hour, rebooking, no-shows, new-patient conversion and diary fill against real rostered hours, plus revenue by practitioner, caseload balance and concentration risk. Framed to coach, never to blame.
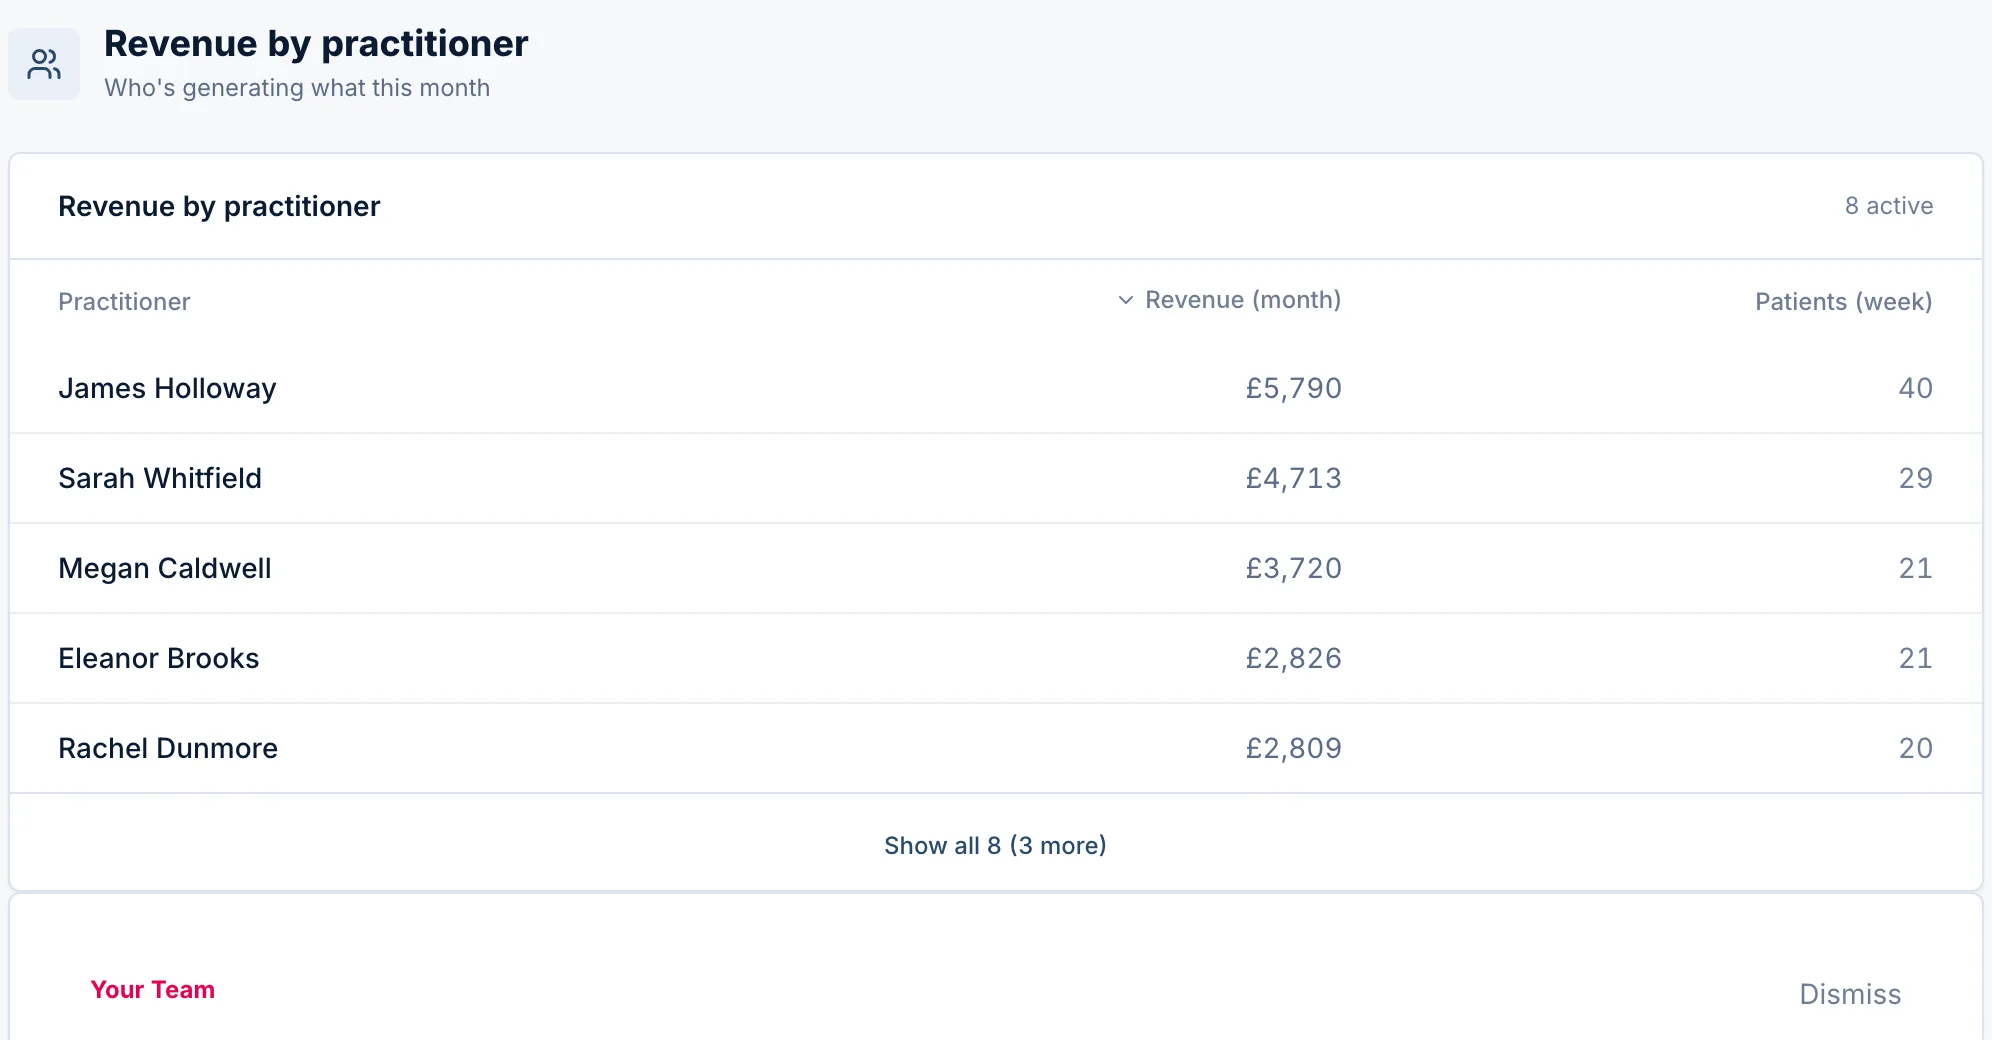
A twelve-month stacked view of revenue by practitioner, the largest contributors named and the rest rolled up, the partial month muted.
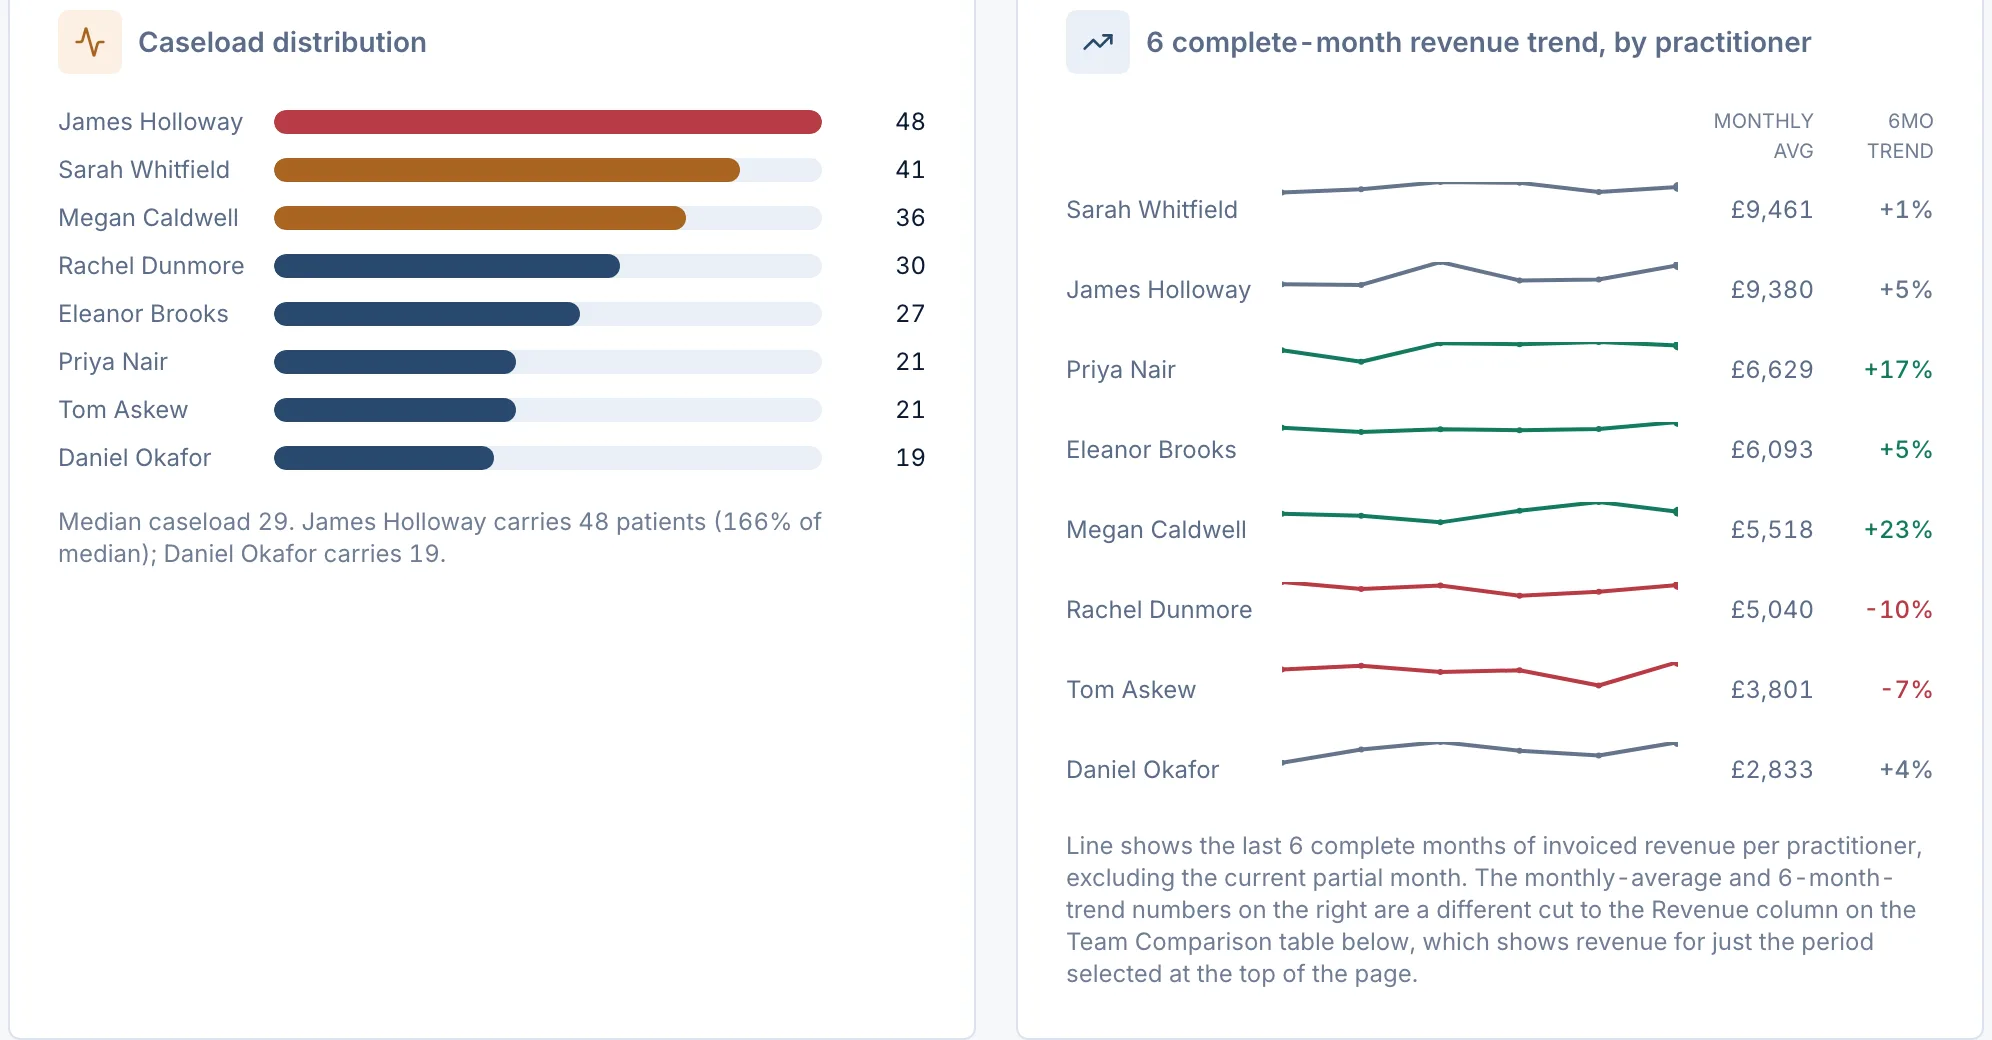
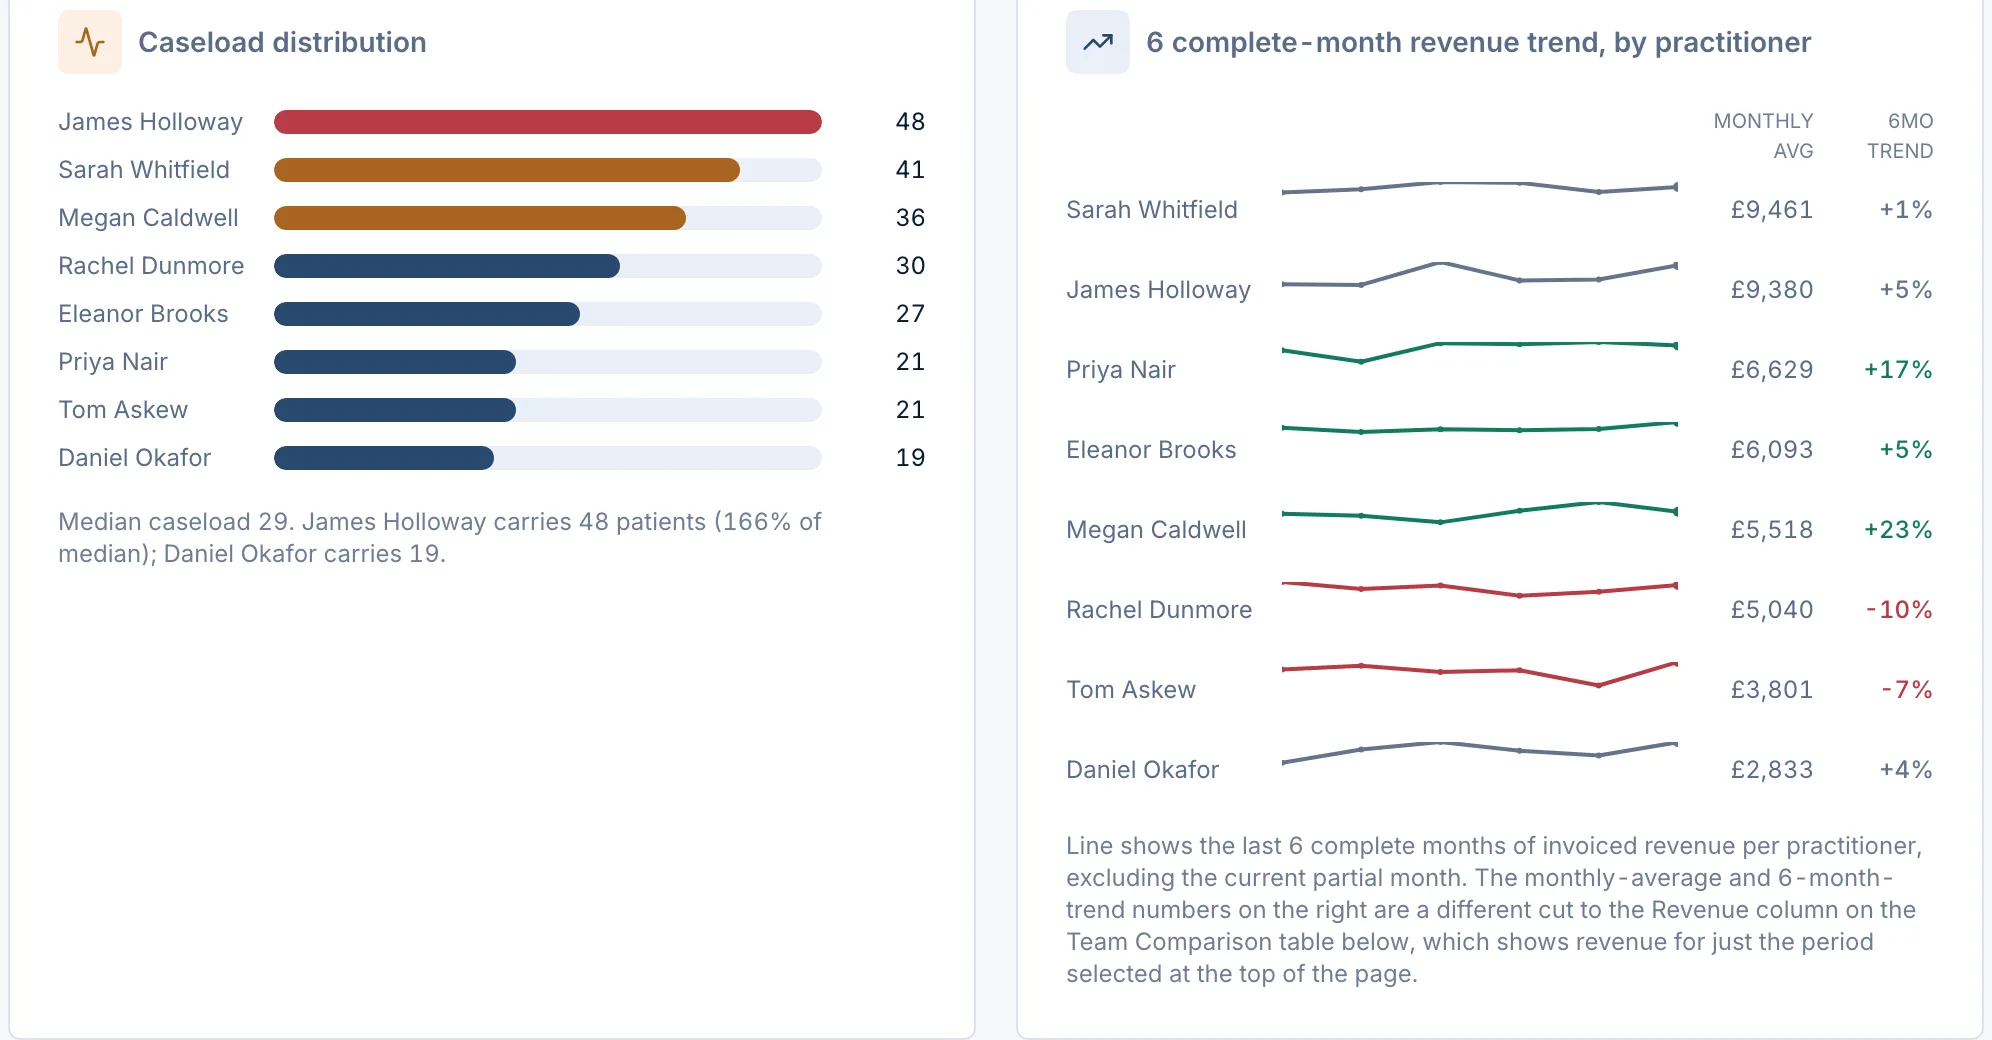
Each practitioner's revenue over the last six complete months with their monthly average and trend arrow.
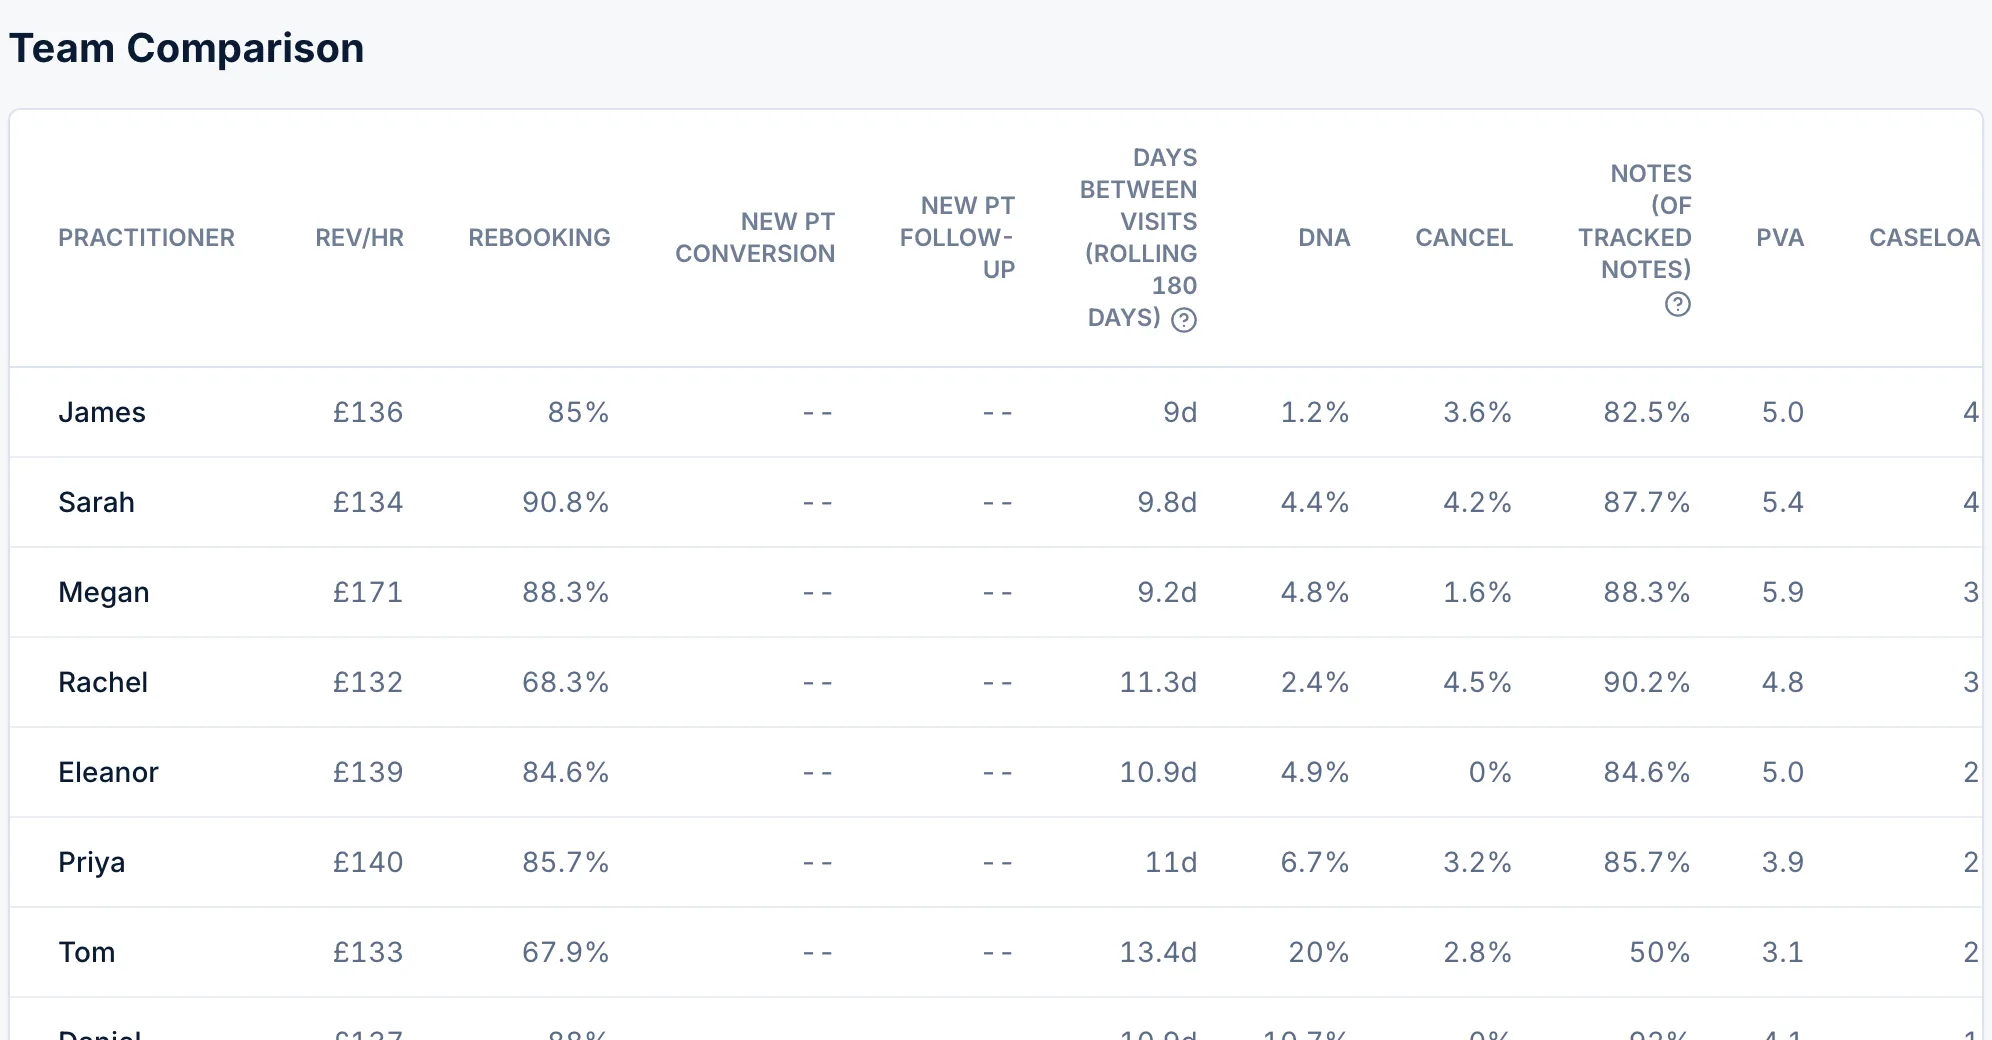
A sortable comparison across revenue per hour, rebooking, DNA, new-patient conversion, days to follow-up, mature visits per patient and caseload.
Every practitioner's active caseload against the clinic median, so key-person concentration shows before it bites.
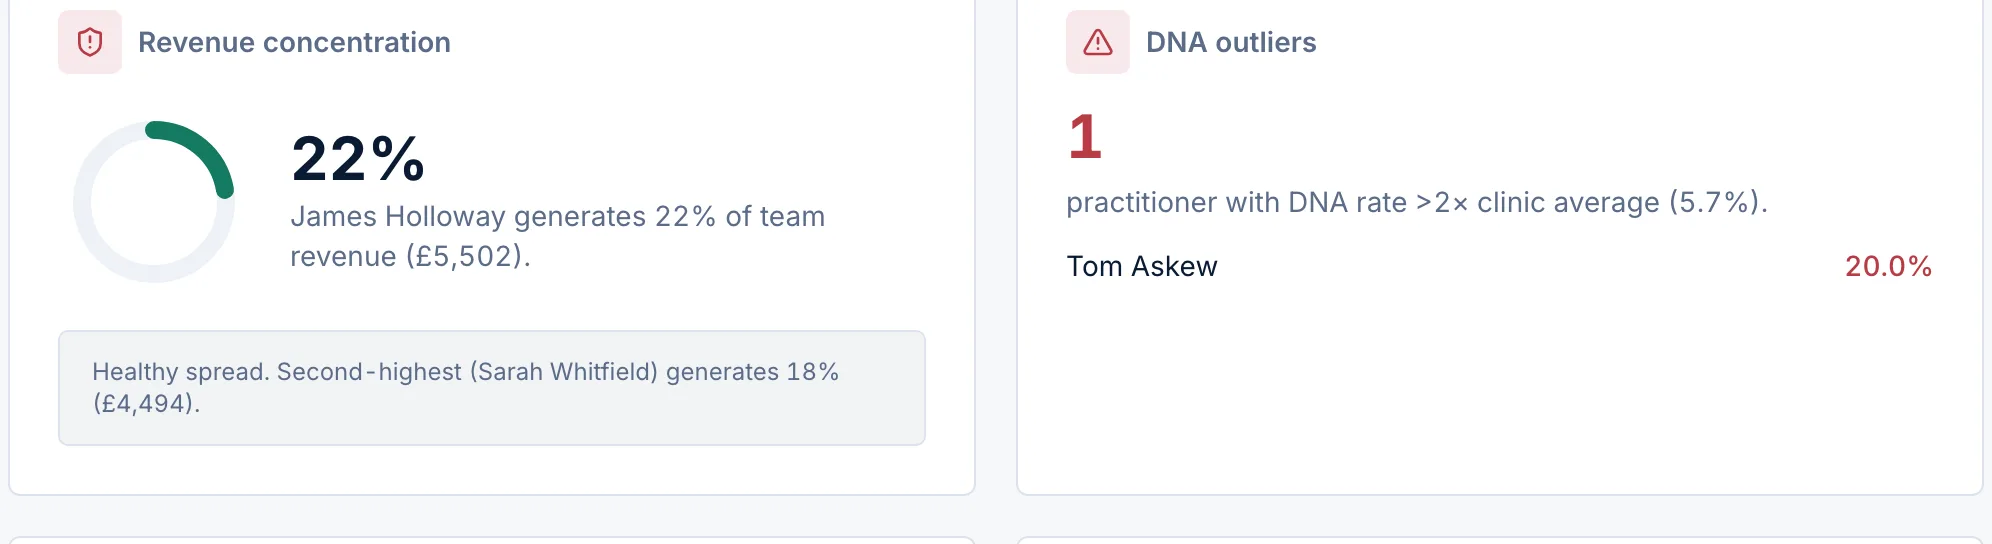
How much of your revenue leans on a single practitioner, flagged when it crosses a level that would hurt if they left.
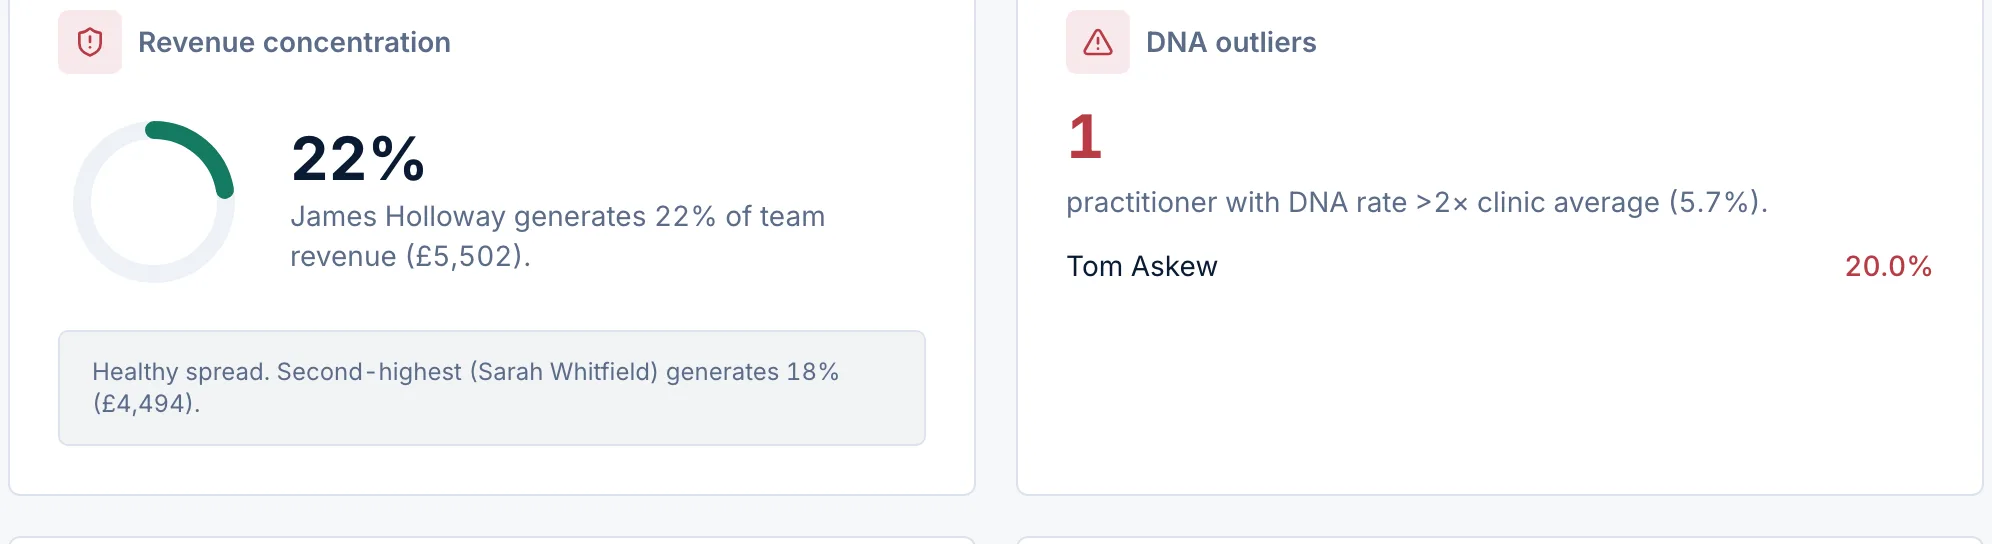
Practitioners whose no-show rate runs well above the clinic average, surfaced as a coaching prompt.
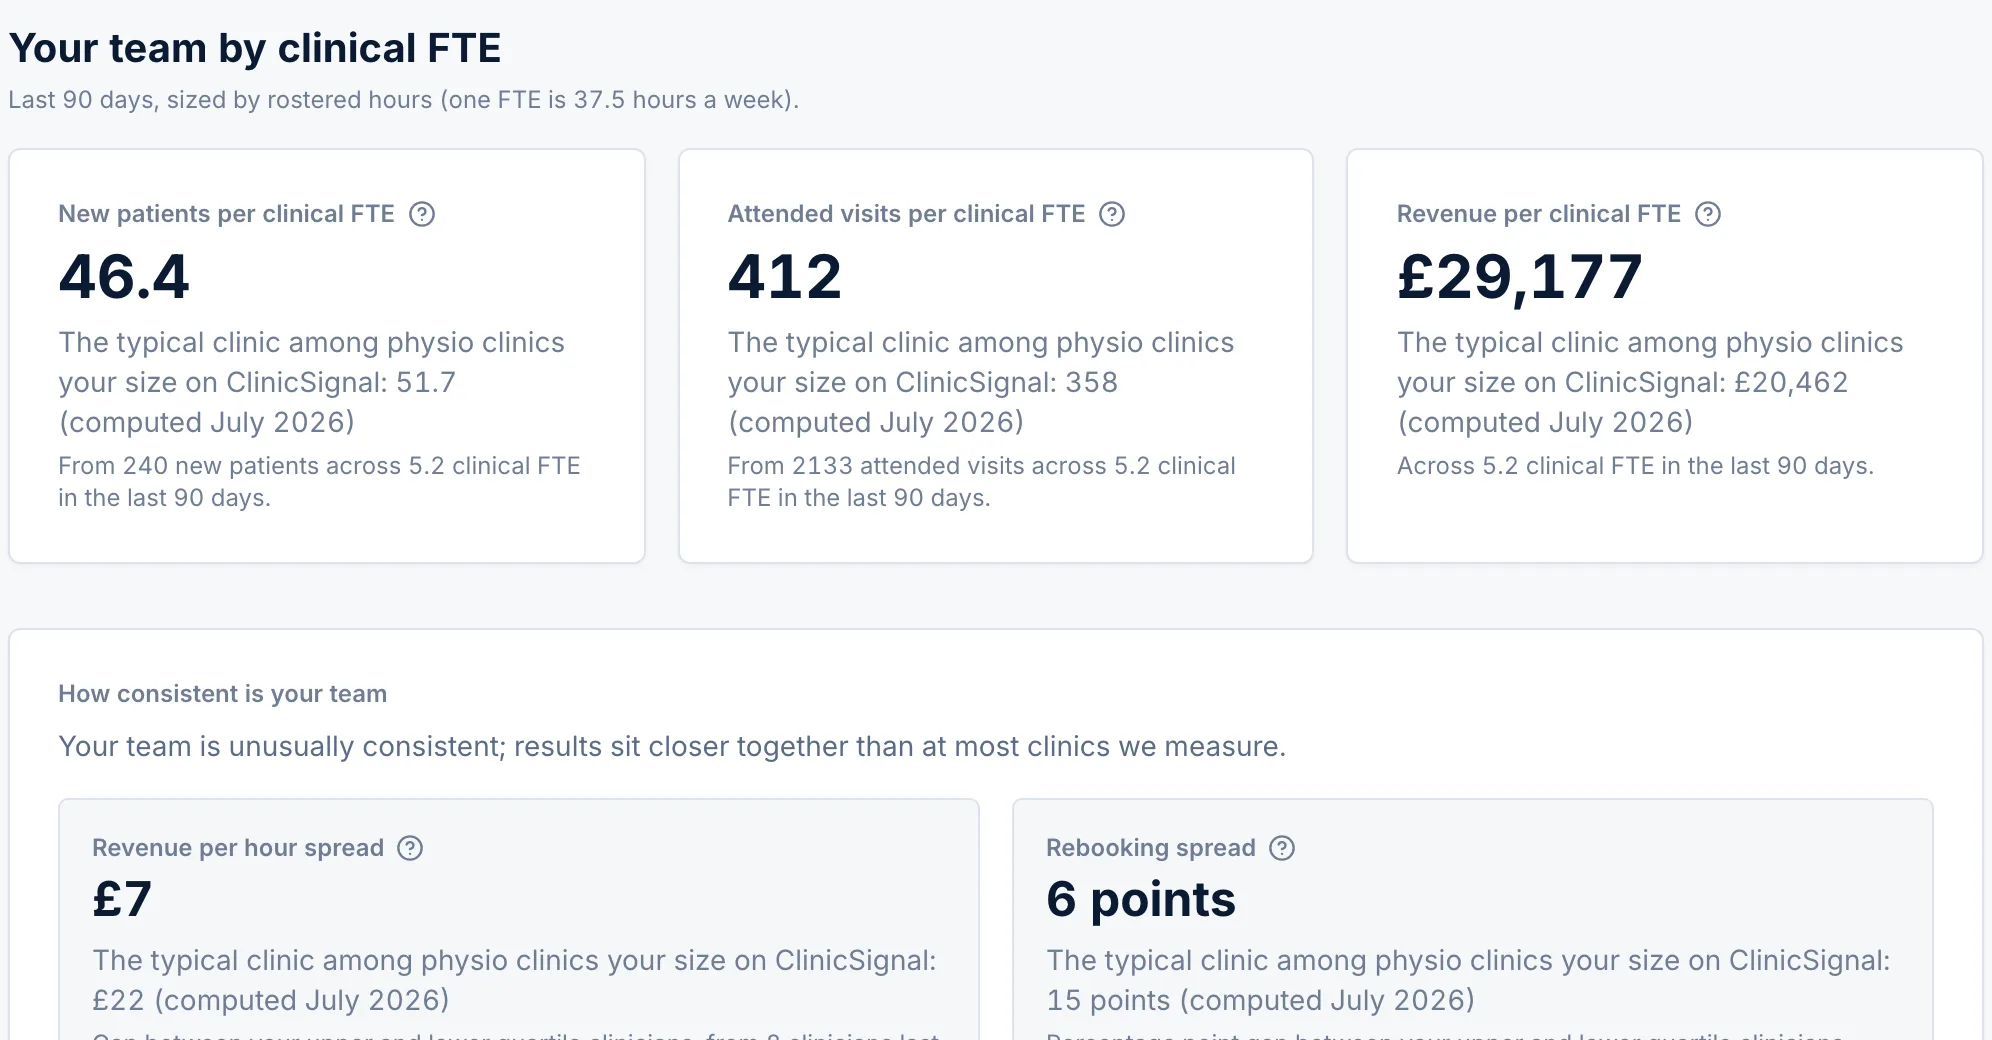
New patients, attended visits and revenue per clinical FTE, each beside the figure for the typical clinic on ClinicSignal. Below it, how consistent your team is: the spread between your upper and lower quartile clinicians on revenue per hour and rebooking, with nobody named.
Fair, supportive per-practitioner numbers on real hours.