Features/The dashboard
The dashboard

Who is coming back,
who is slipping away.

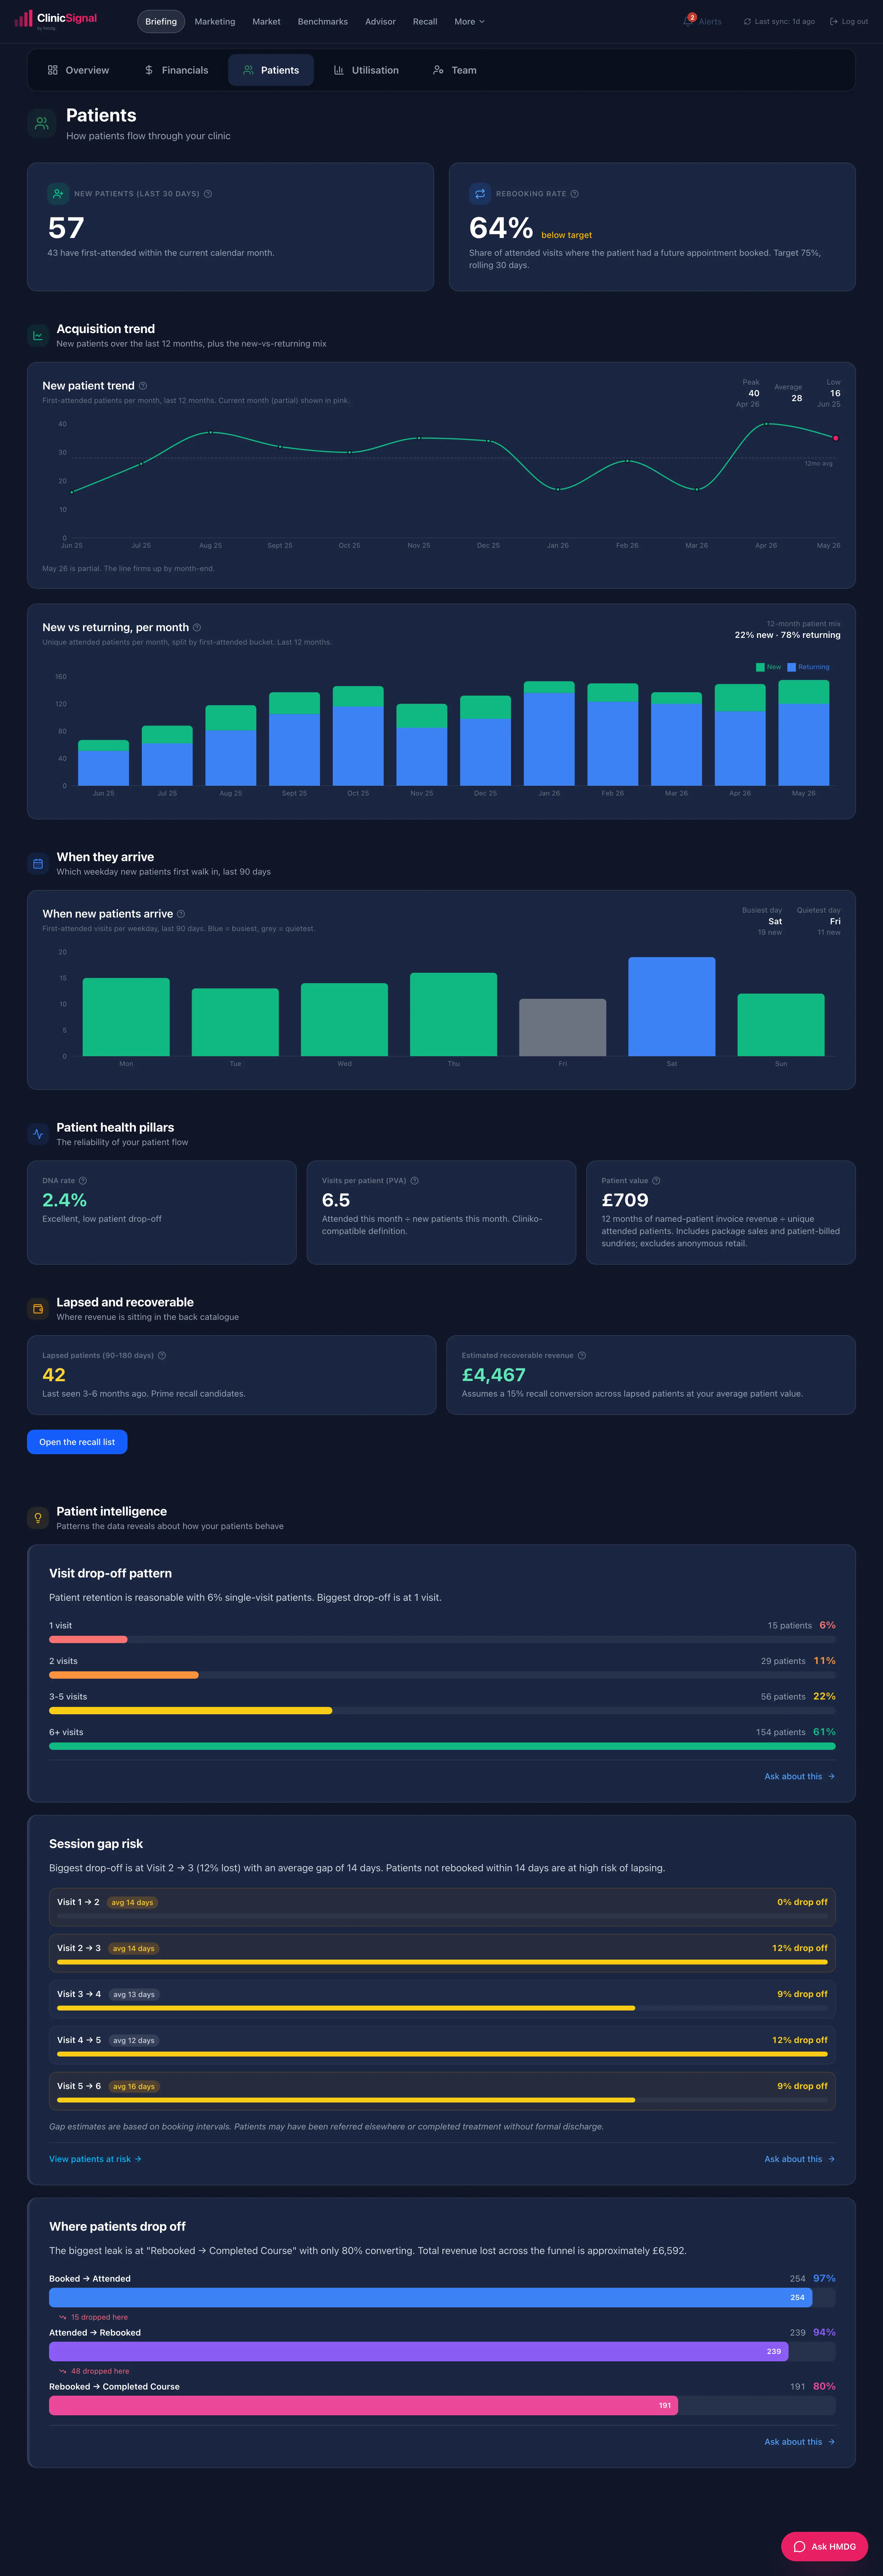
The behaviour that decides next quarter's revenue: a closed-cohort funnel that tells the truth about return rates, the value of a patient as it builds over months, why they cancel, and the patients who have quietly gone quiet.

/dashboard · Patients
01The intake funnel

Booked, attended, returned. One honest base.

A closed cohort on a single denominator, so it never quietly pre-selects the patients who stopped coming.
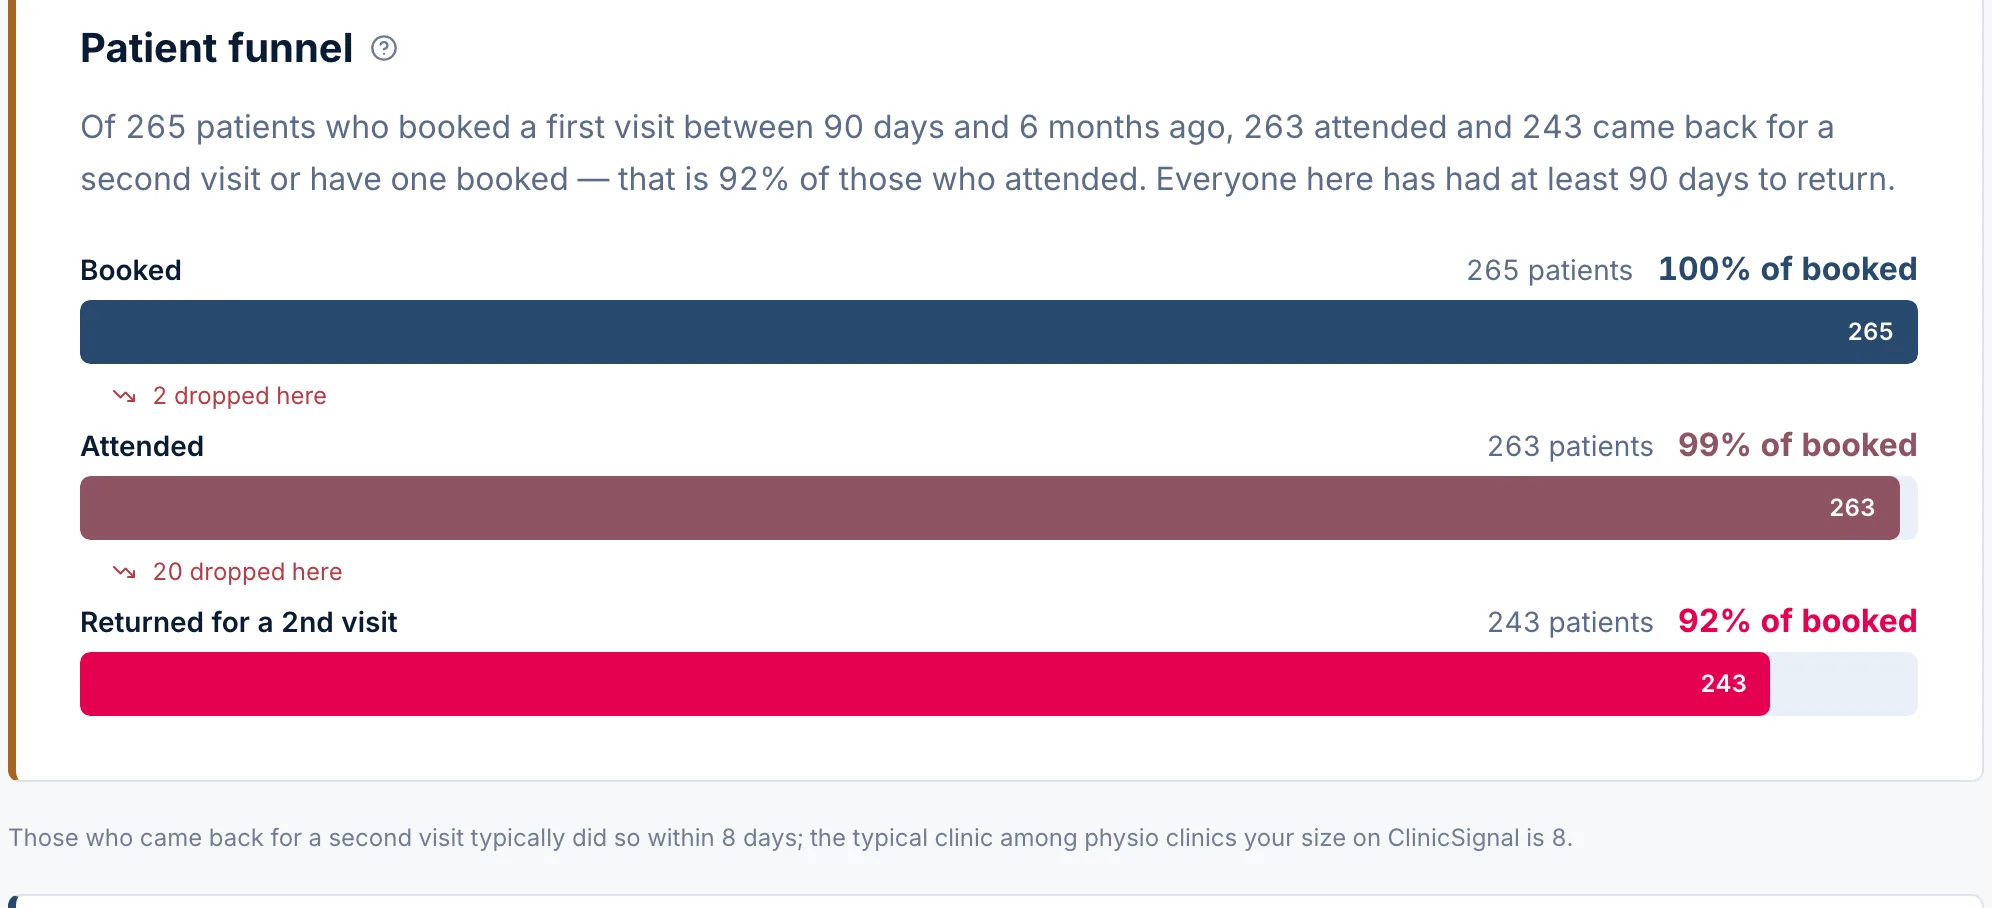
  • One cohort, one denominator, no flattering
  • Return is a real second visit or a future booking
  • The true intake picture, not a survivor's view
Patients · Funnel
Patients · Funnel
02Patient value over time

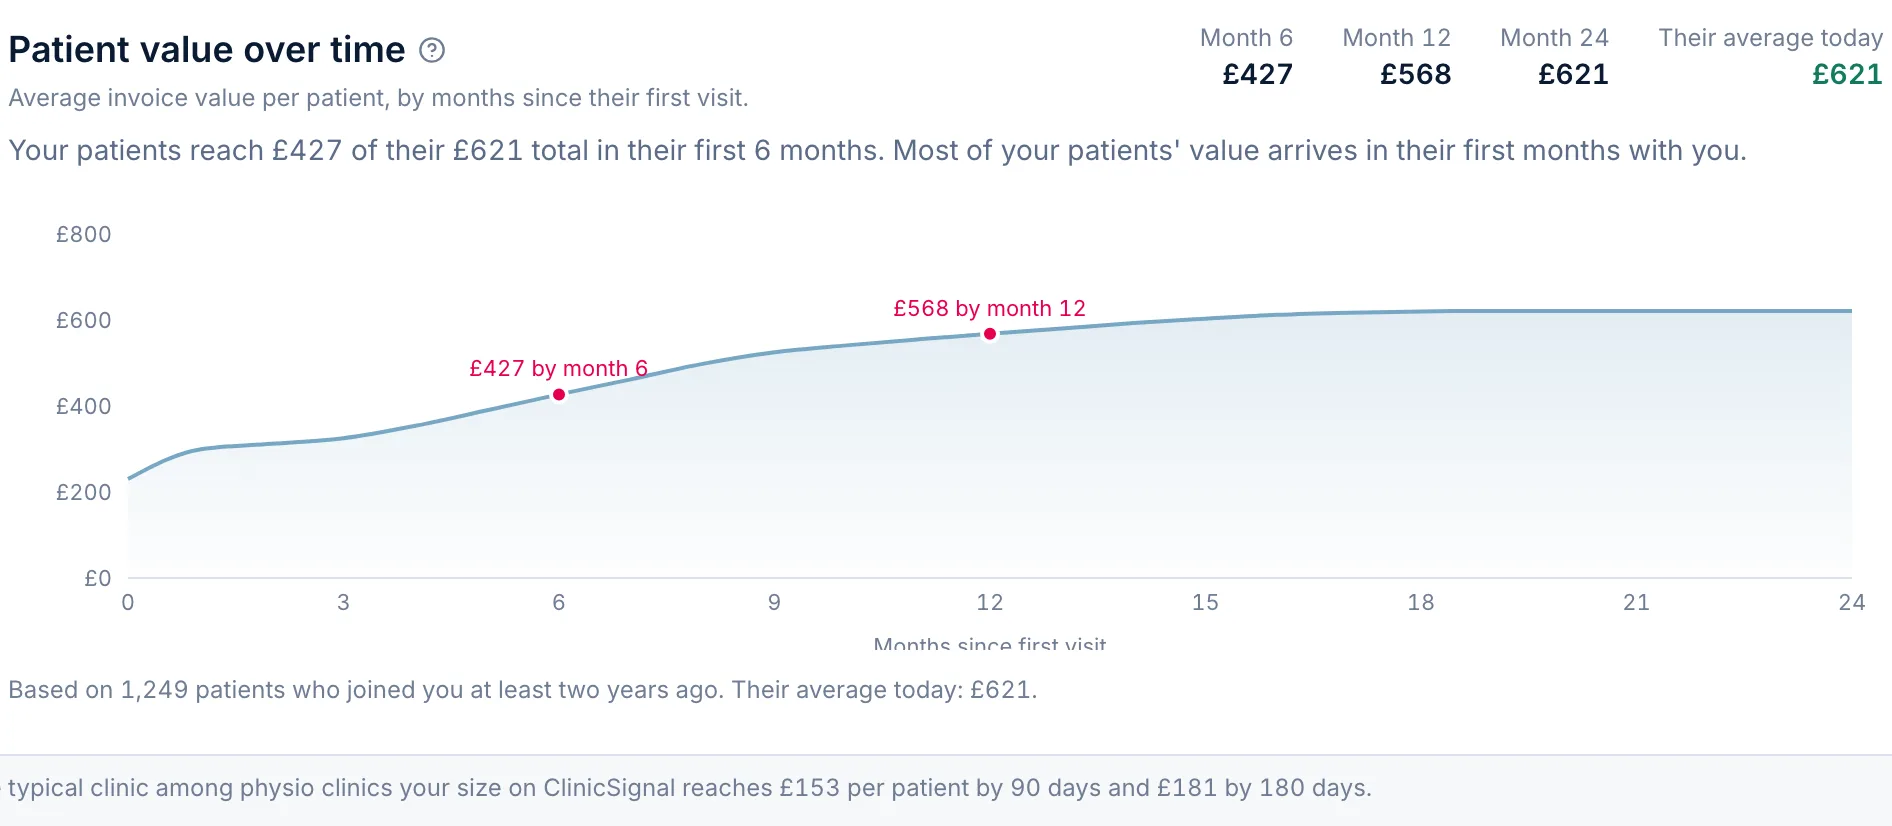
What a patient is really worth.

Cumulative average revenue per patient by months since first visit, from a mature cohort, so chronic caseloads show their full value.
Patients · Value curve
03New vs returning

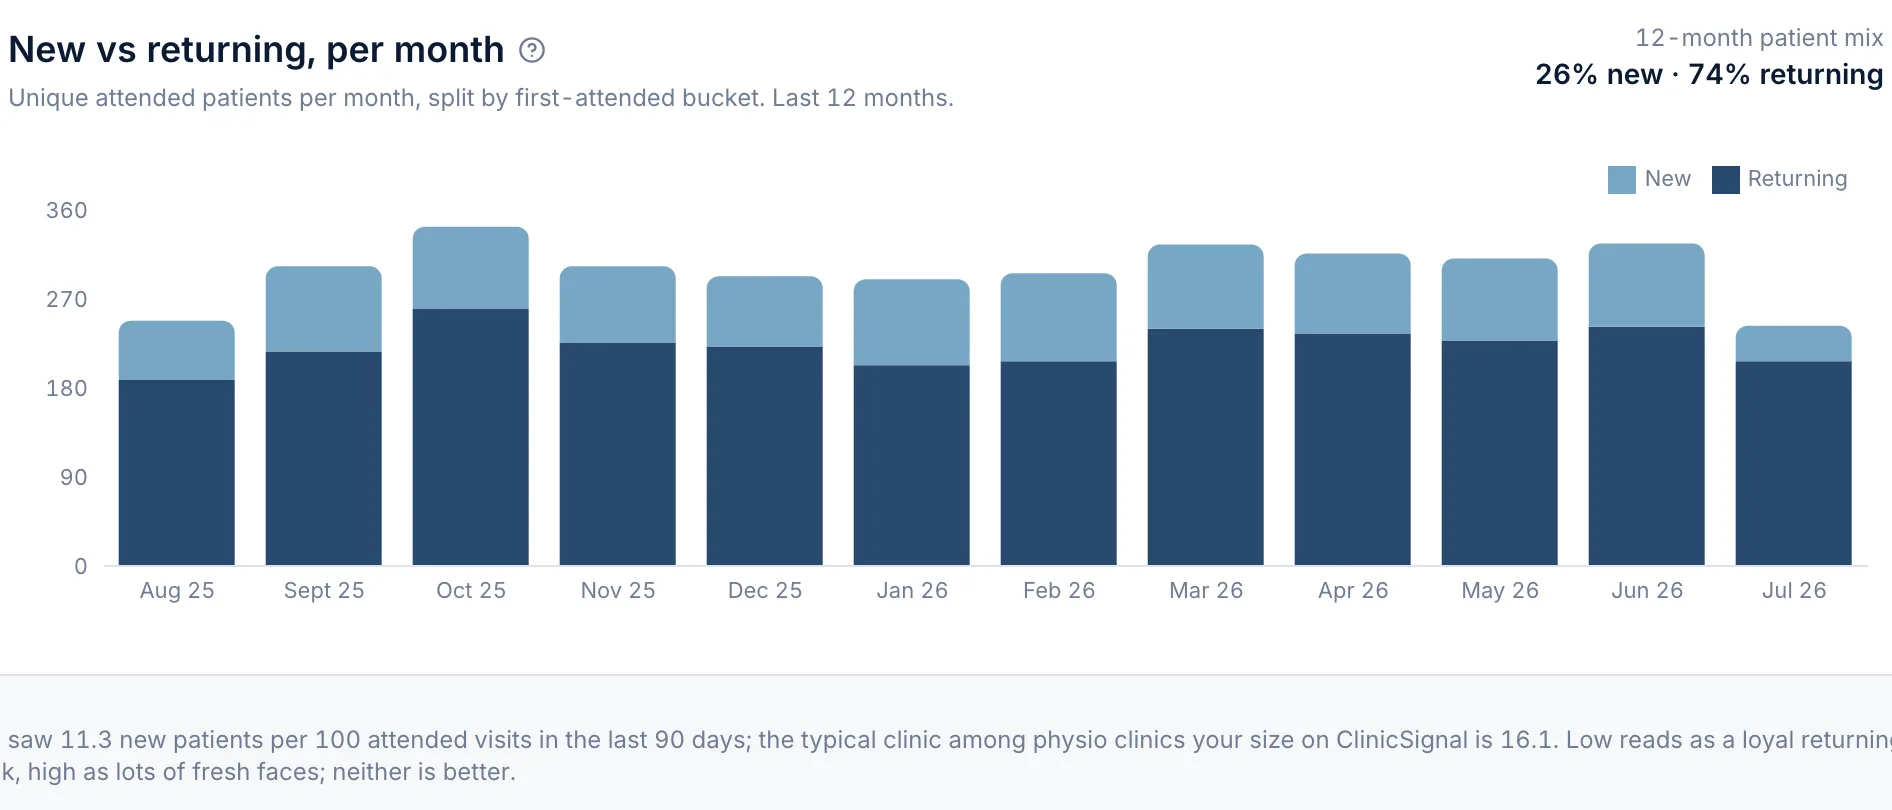
Where growth comes from.

New and returning patients month by month, so you can see whether growth is fresh acquisition or a loyal base returning.
Patients · New vs returning
04When they arrive

When new patients book.

The days and times new patients tend to first book, so you can staff initial-assessment capacity to real demand.
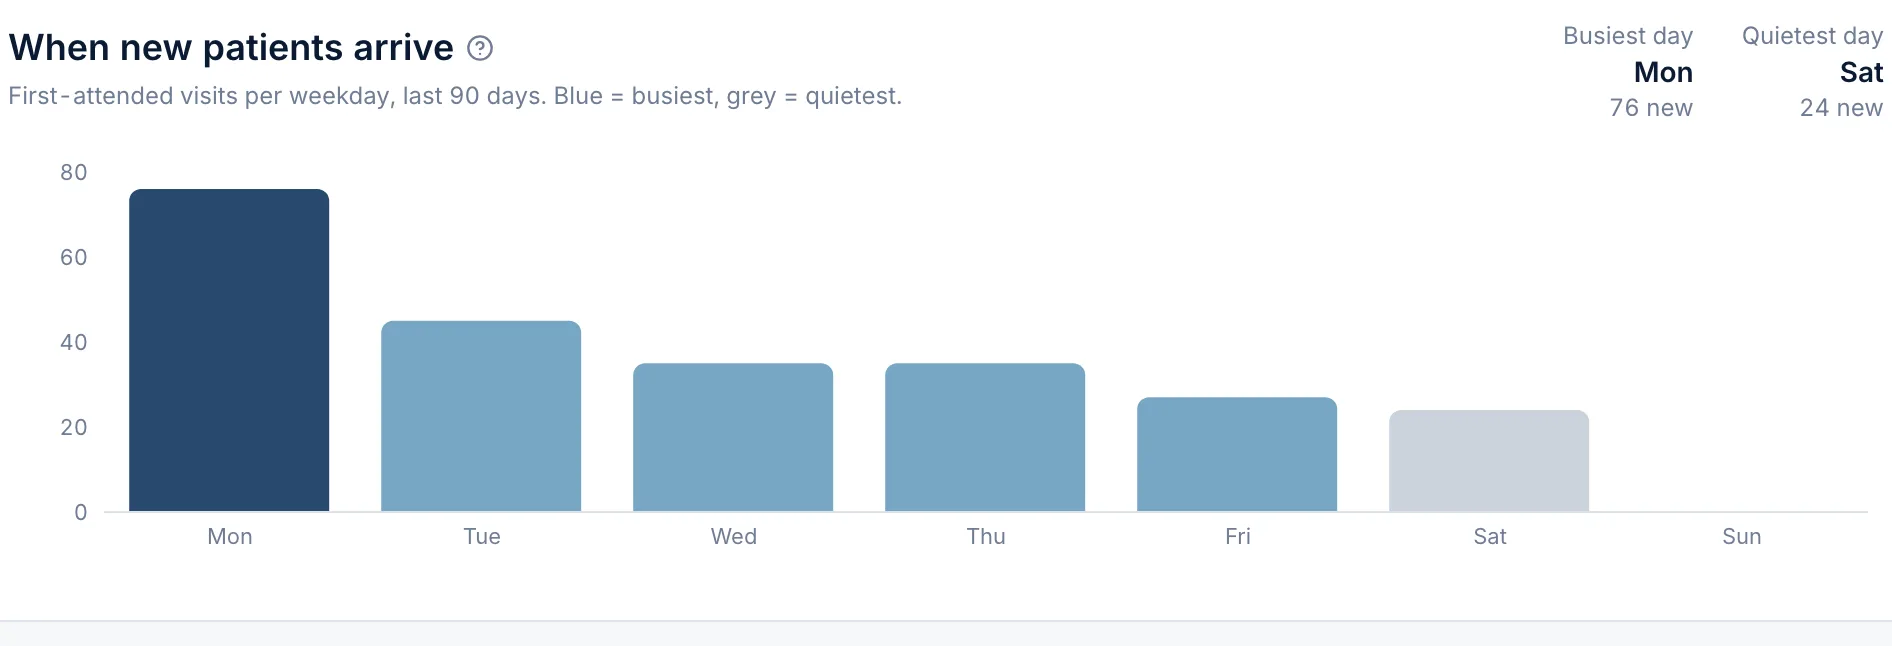
Patients · When new patients arrive
05Why patients cancel

The reasons behind the gaps.

Cancellation reasons where your PMS captures them, so a wave of 'feeling better' reads differently from a wave of 'cost'.
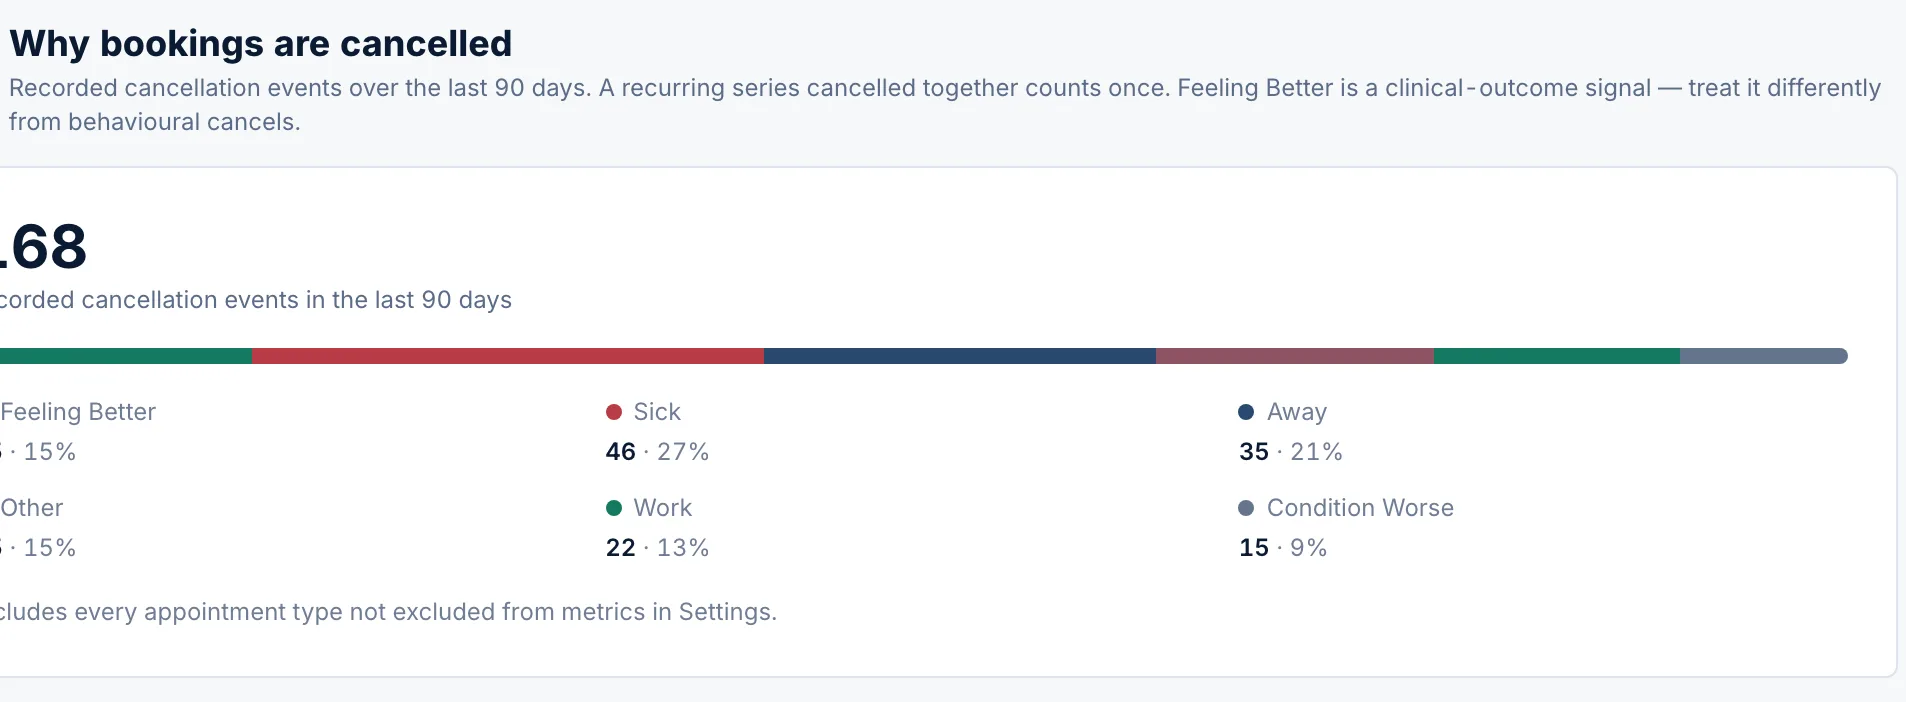
Patients · Why patients cancel
06Where referrals come from

Your real acquisition sources.

New patients by referral source at intake, so you can see how much growth is word of mouth, GP, or your own marketing.
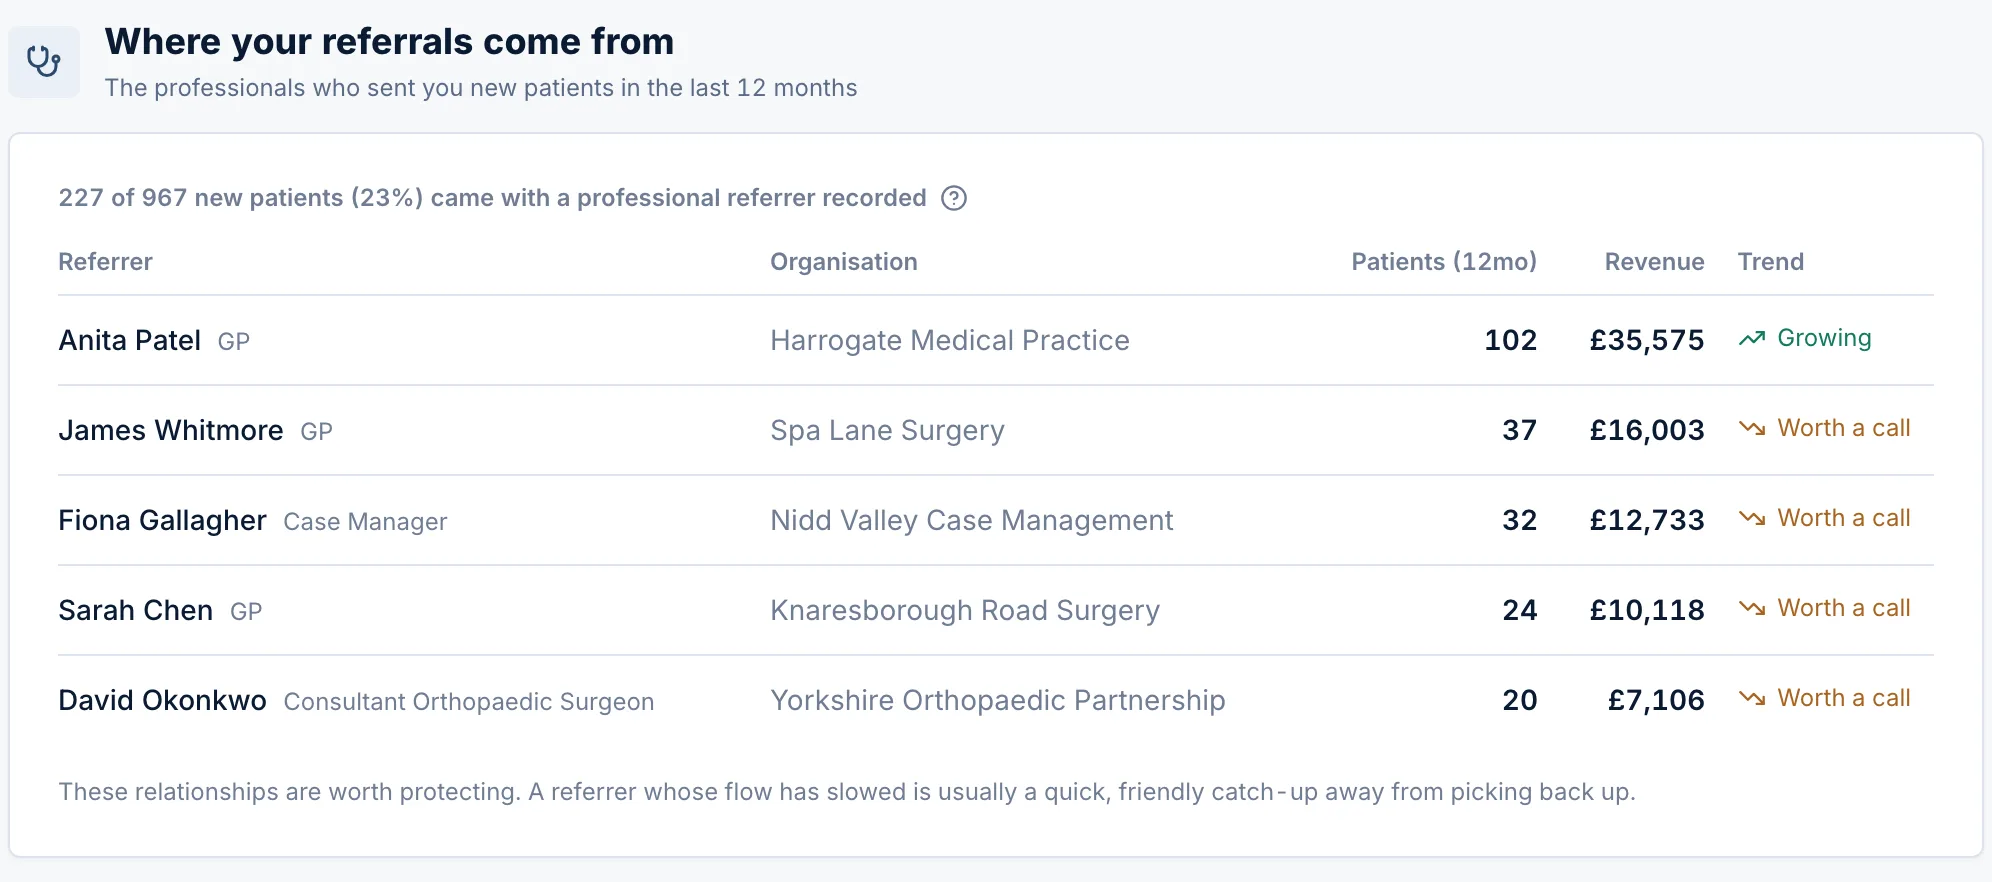
Patients · Referral sources
07Lapsed and recoverable

Who has gone quiet.

How many patients have gone quiet and what they were worth, with a recoverable total that feeds straight into recall.
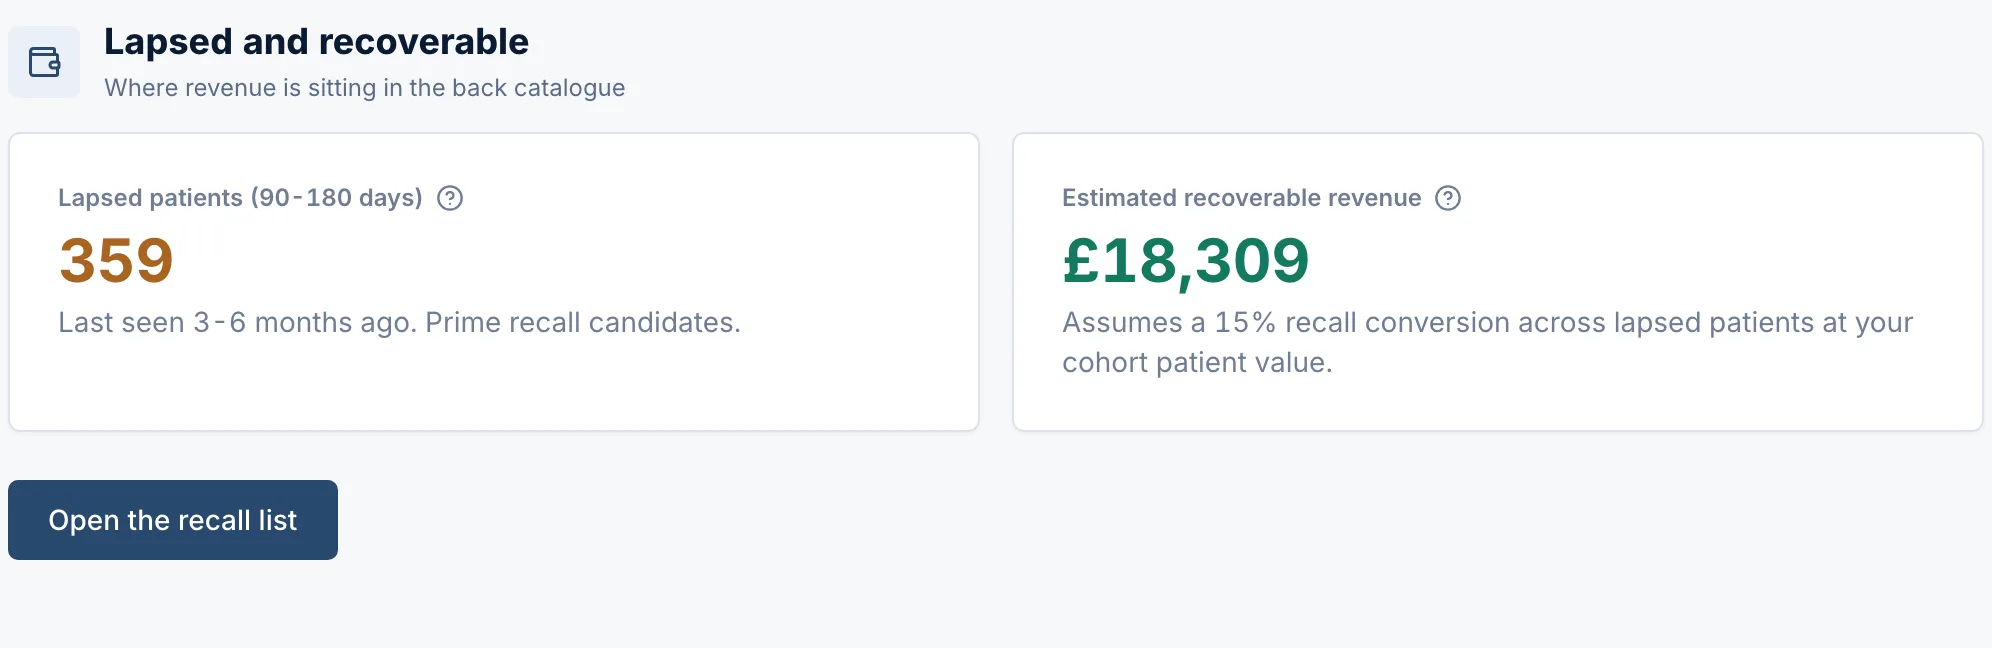
Patients · Lapsed and recoverable
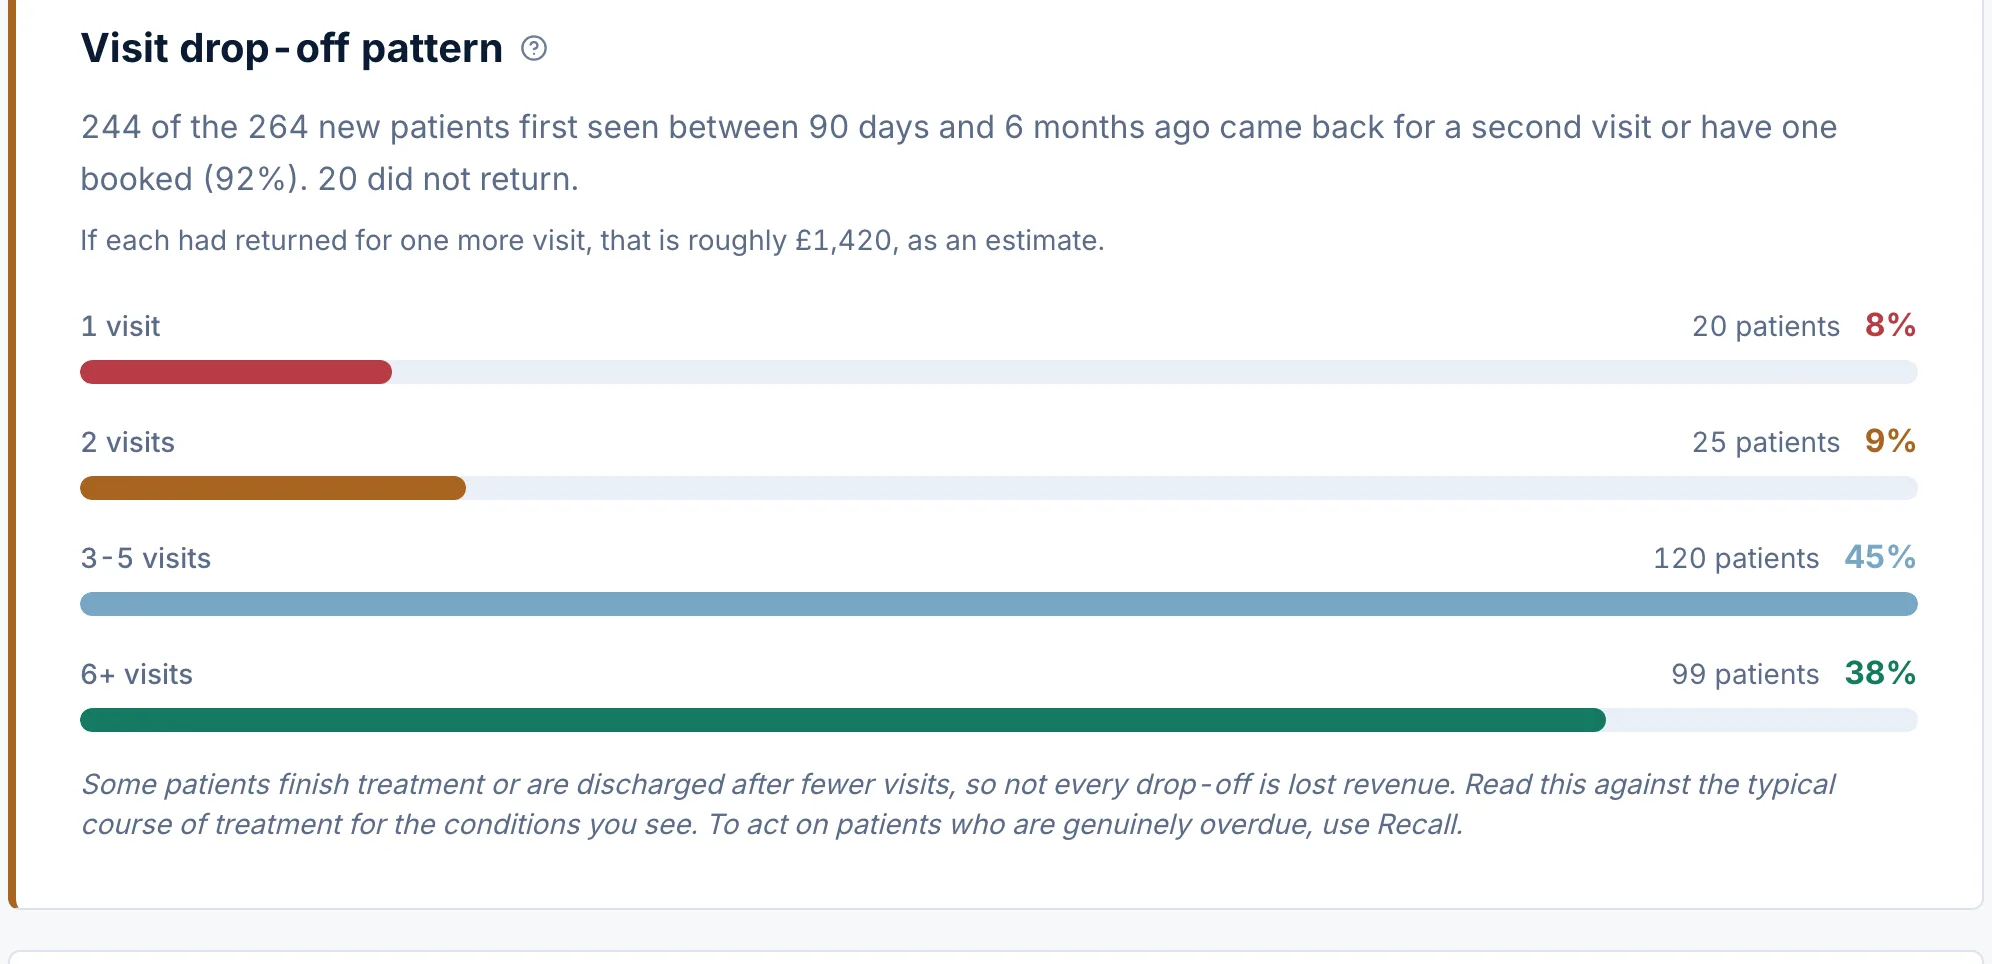
08Drop-off by clinician

Where patients go quiet.

Drop-off attributed by clinician as a share of their own new patients, framed as a coaching signal rather than blame.
Patients · Drop-off
Patients · Drop-off
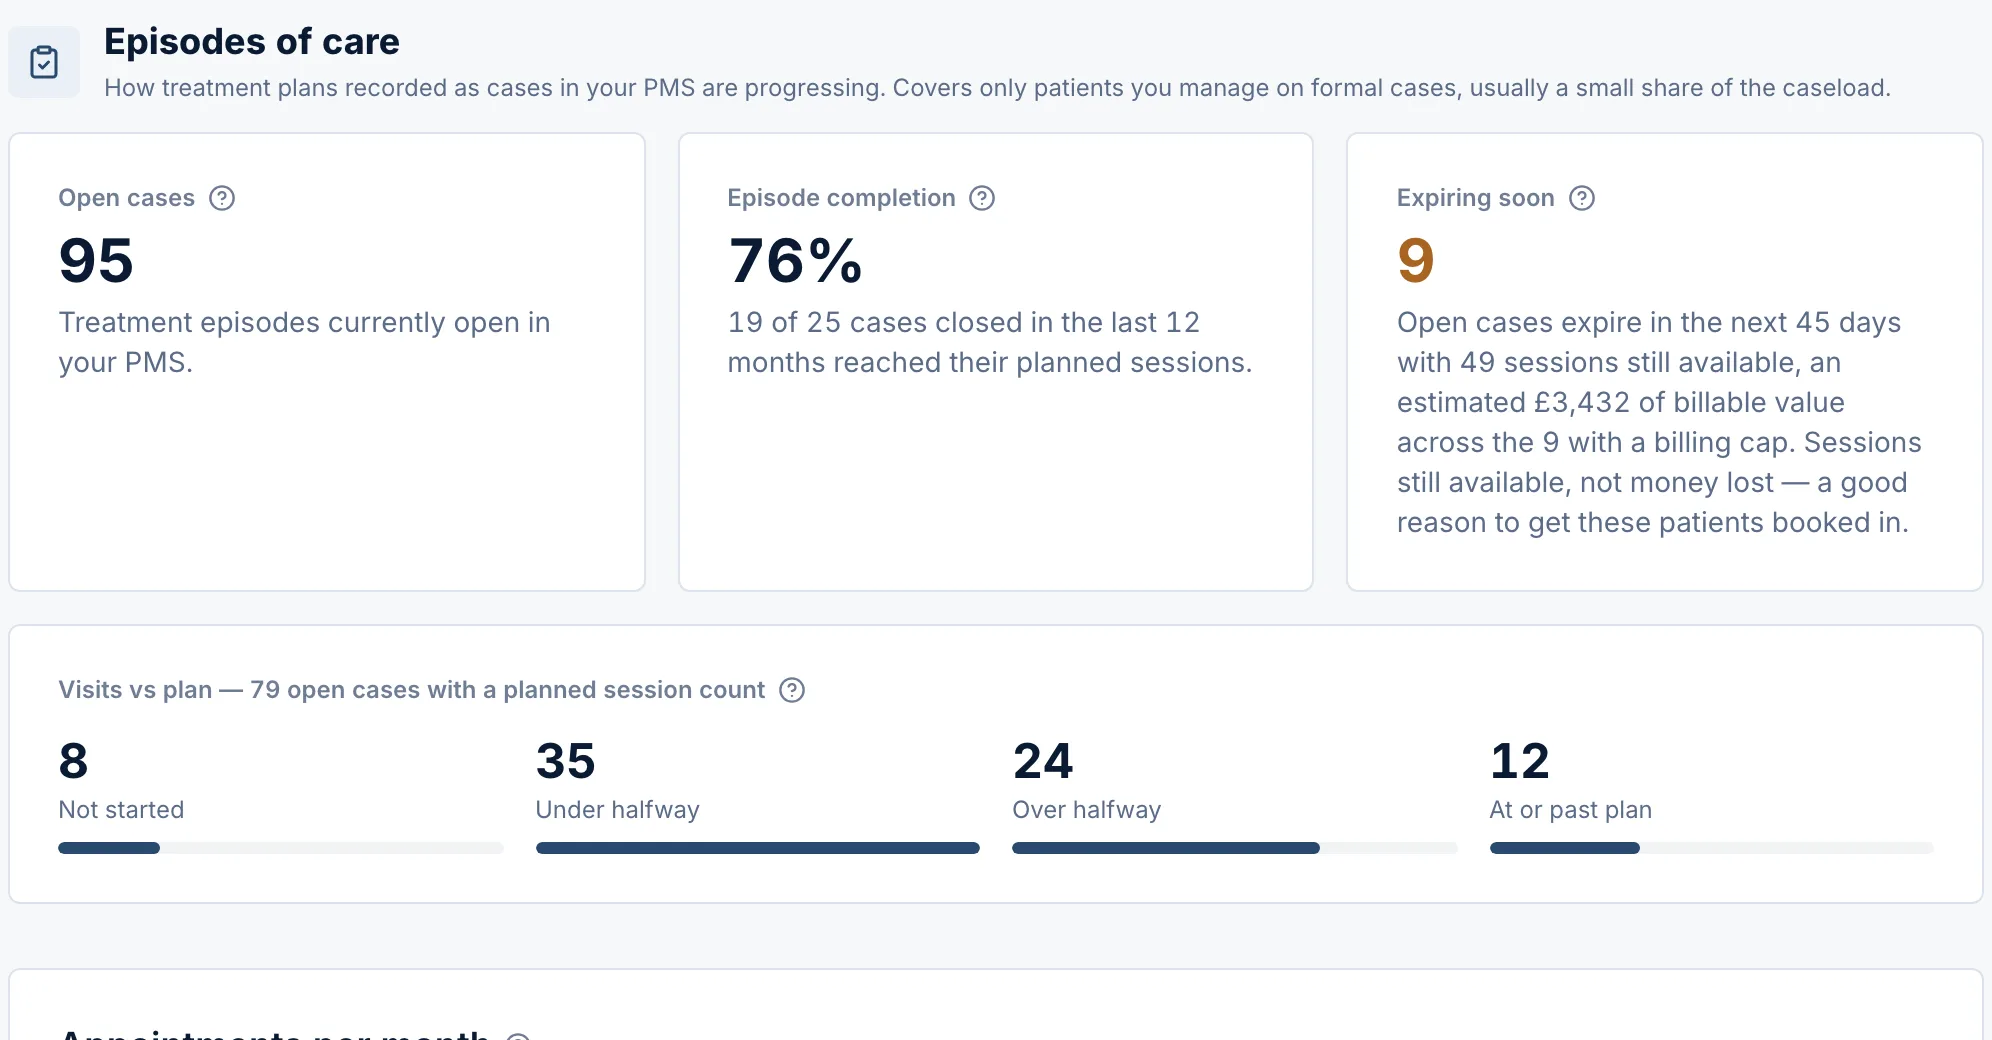
09Episodes of care

Whole treatment episodes.

Care grouped into episodes rather than loose appointments, so you can see how many sessions a course runs to.
Patients · Episodes of care
10Compared with clinics like yours

Your patient journey, in context.

The journey cards carry the figure for the typical clinic on ClinicSignal beside your own: days between visits split by tenure, established patient workload, how fast second visits happen and new patients per 100 visits. Every value shows with the records behind it, so small samples read as what they are.

Patients · In context
How it is worked out

The numbers behind it.

The cohort is patients whose first attended, non-excluded visit falls 90 to 180 days ago, giving each episode time to play out. Patient value is measured from named-patient invoices only when the cohort is large and mature enough, else a labelled setup estimate. No patient names are ever stored; where recall needs them they are fetched live and held only for that request.
Where it shows up

It travels with you.

Lapsed patients flow into patient recall, and patient value feeds the return-on-ad-spend maths across marketing.
Keep exploring
Patient recallThe revenue hiding in your listTeamRebooking and follow-up by practitionerBenchmarksHow your rebooking compares

See who is slipping away.

The closed-cohort truth about your patient behaviour.

Sign up → Start free trial