/dashboard/market
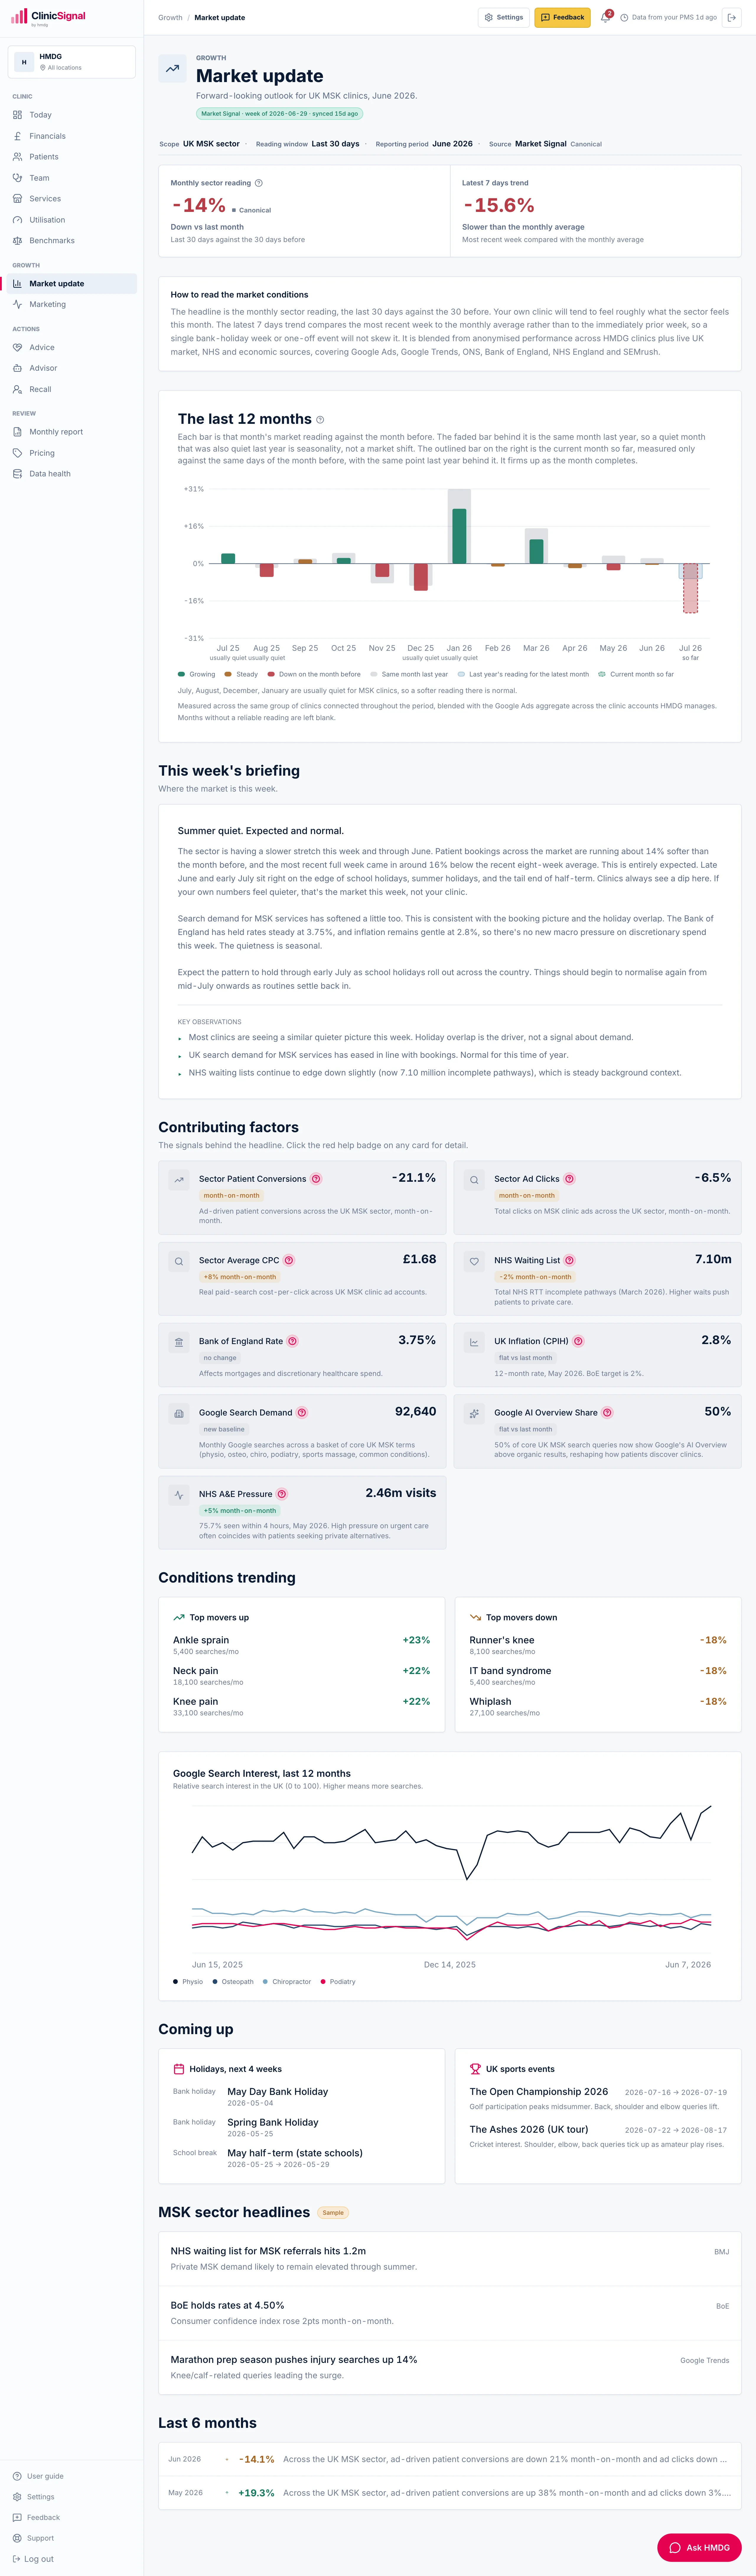
The question every owner asks in a quiet week, finally answered with data. ClinicSignal reads the whole UK MSK market every week, shows the last 12 months against the same months last year, and tells you what is the sector and what is your clinic.
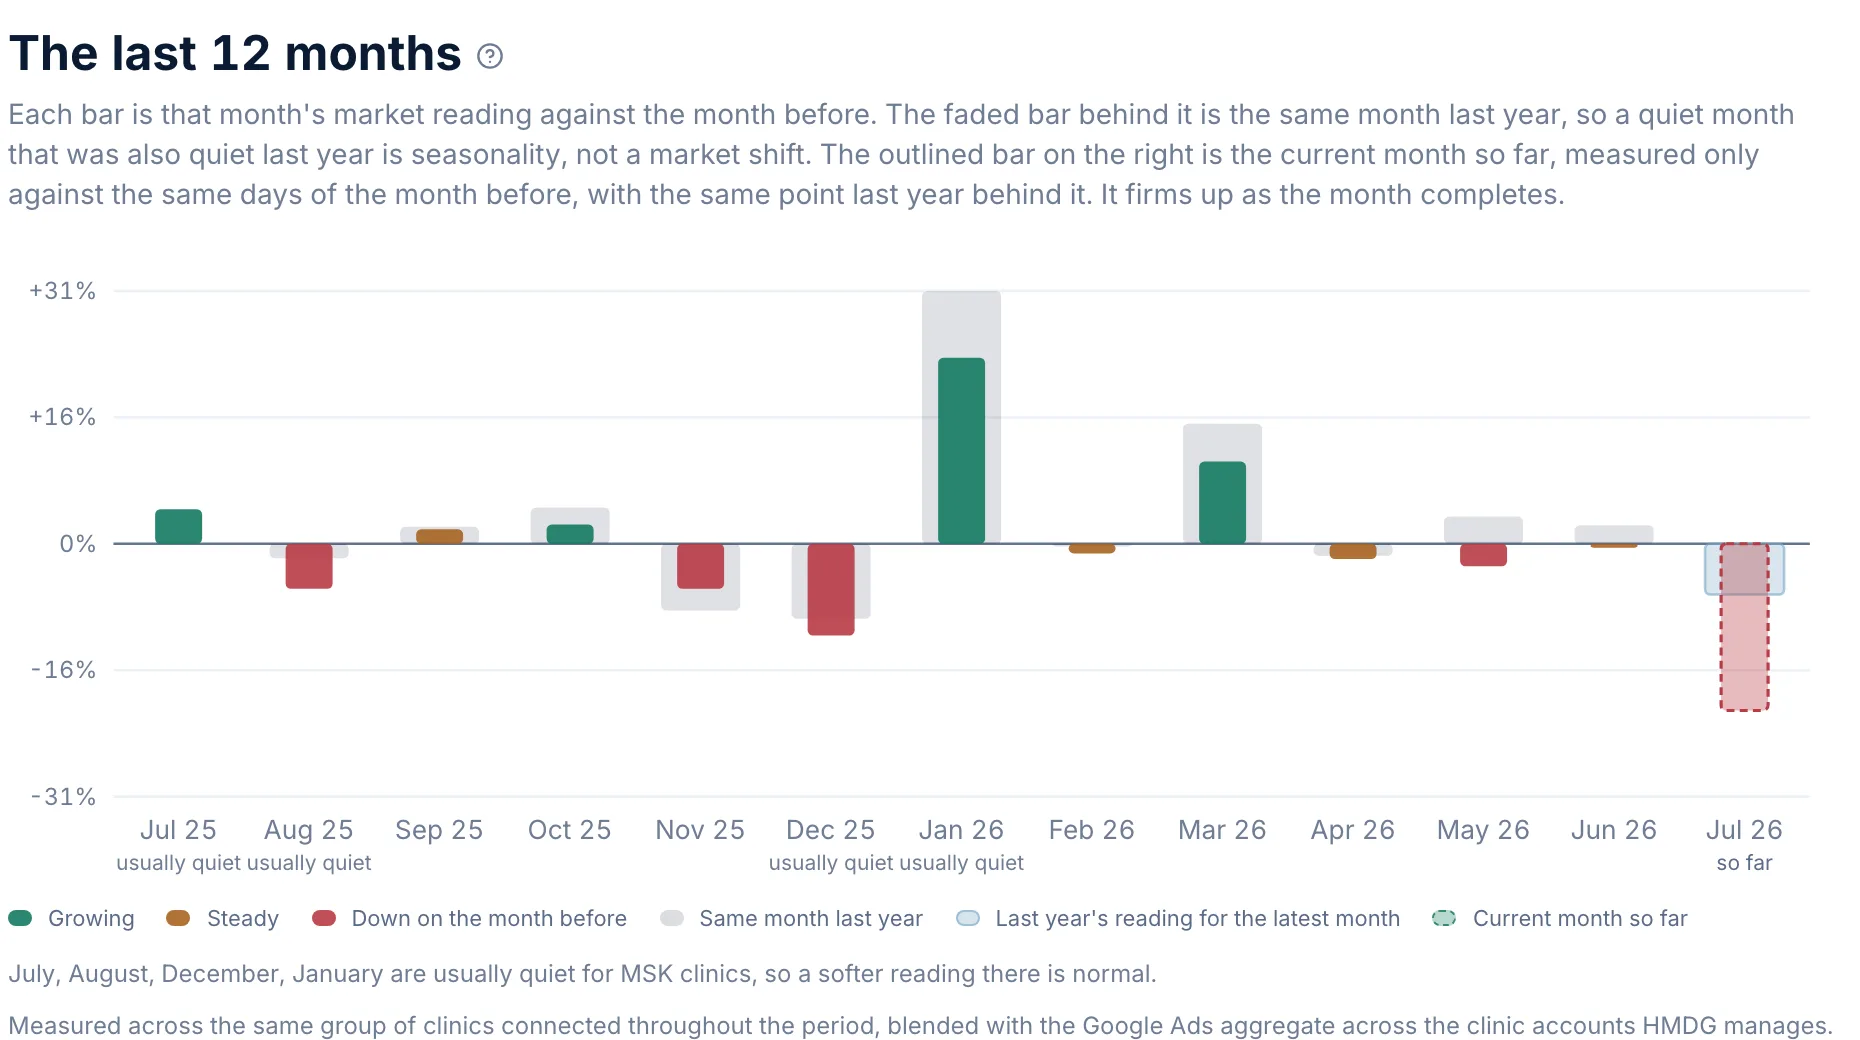
The sector reading, month by month, with the same month last year as a faded bar behind it. A quiet August that was also quiet last August is seasonality. A quiet August that was busy last August is a market shift, and the chart makes the difference obvious at a glance.
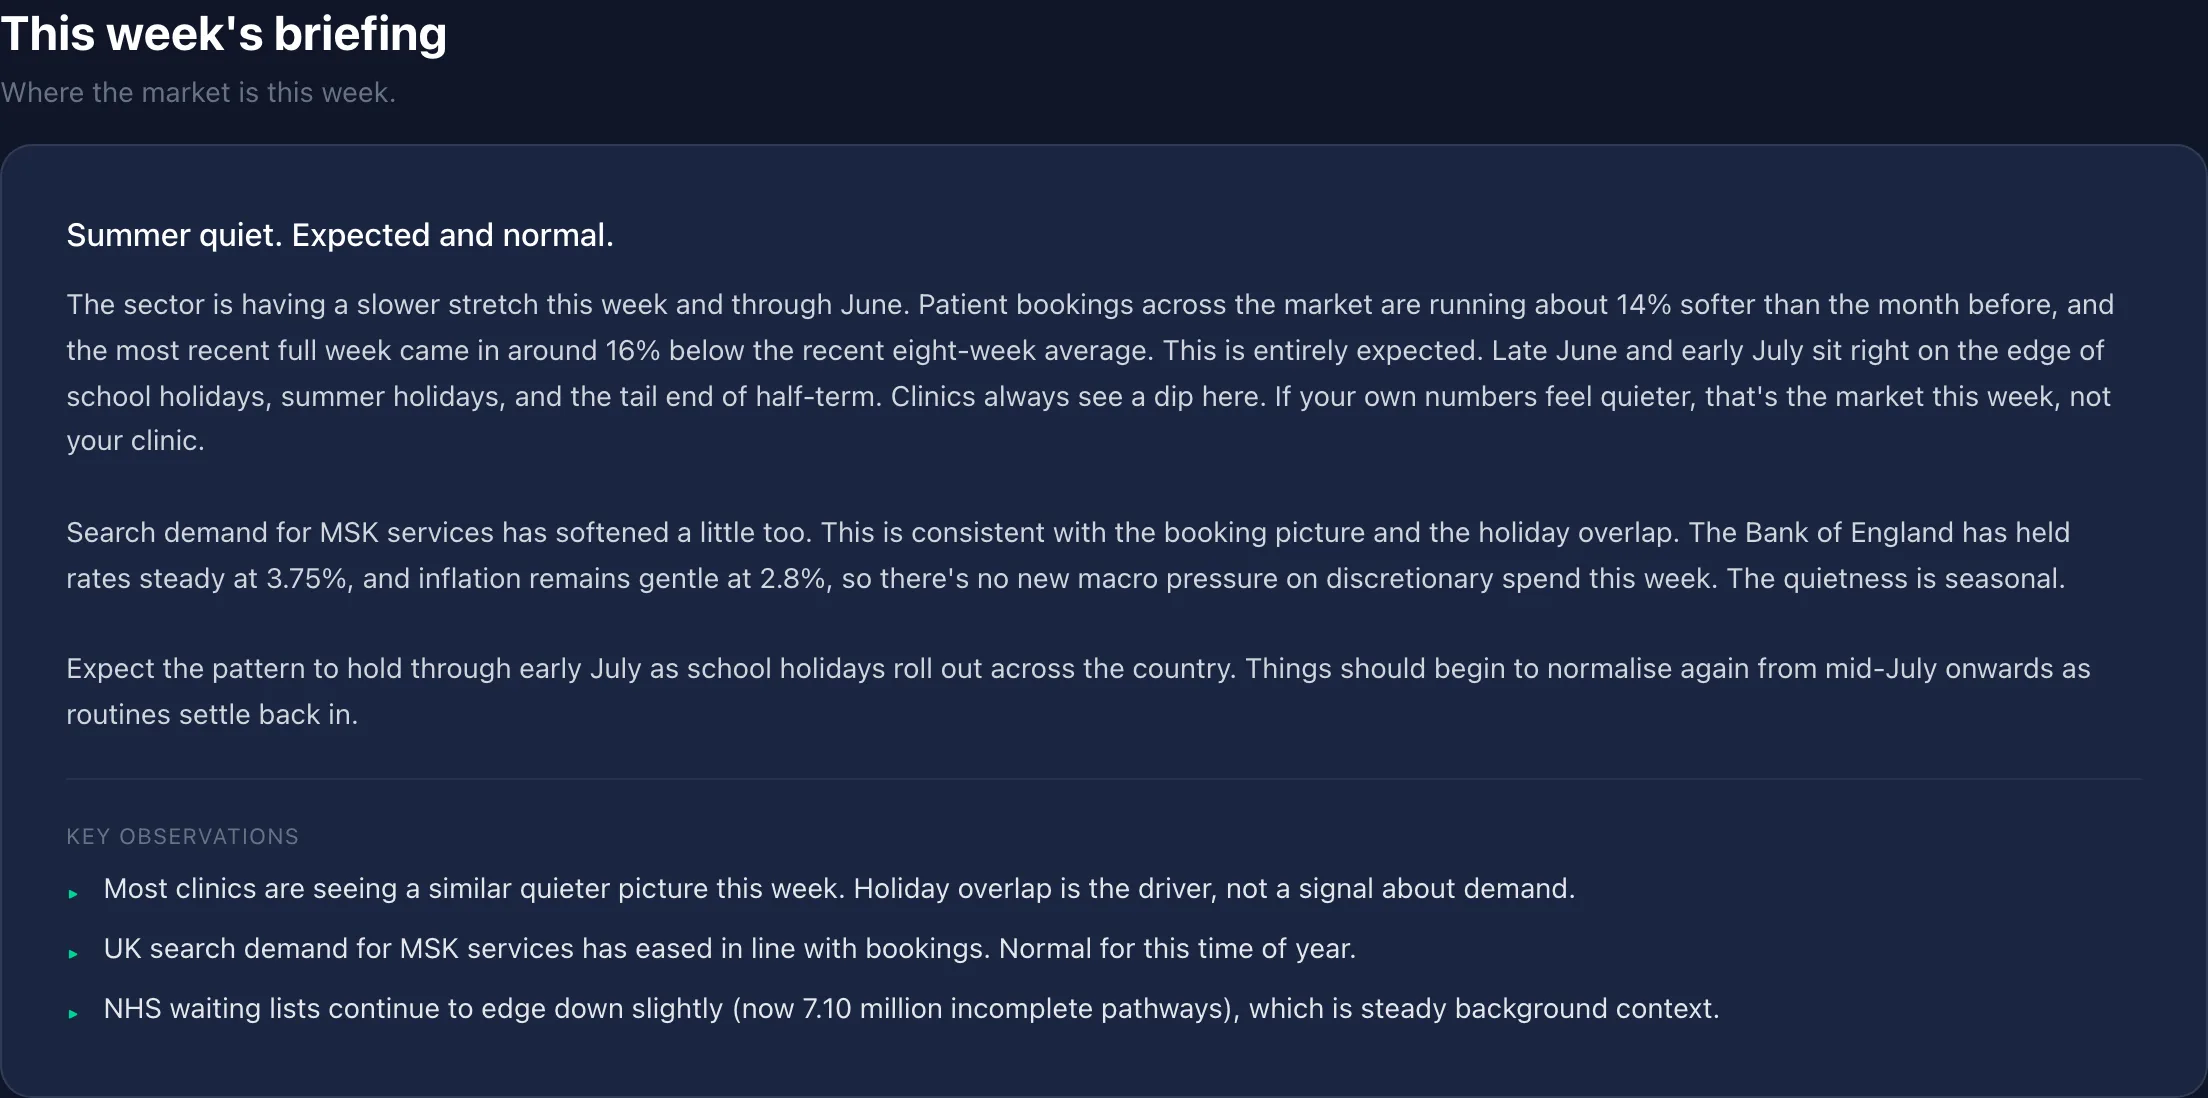
Every week the market data becomes a written brief in plain English: what moved, why, and what it means for a clinic like yours. Calm when the news is seasonal, direct when it is not.
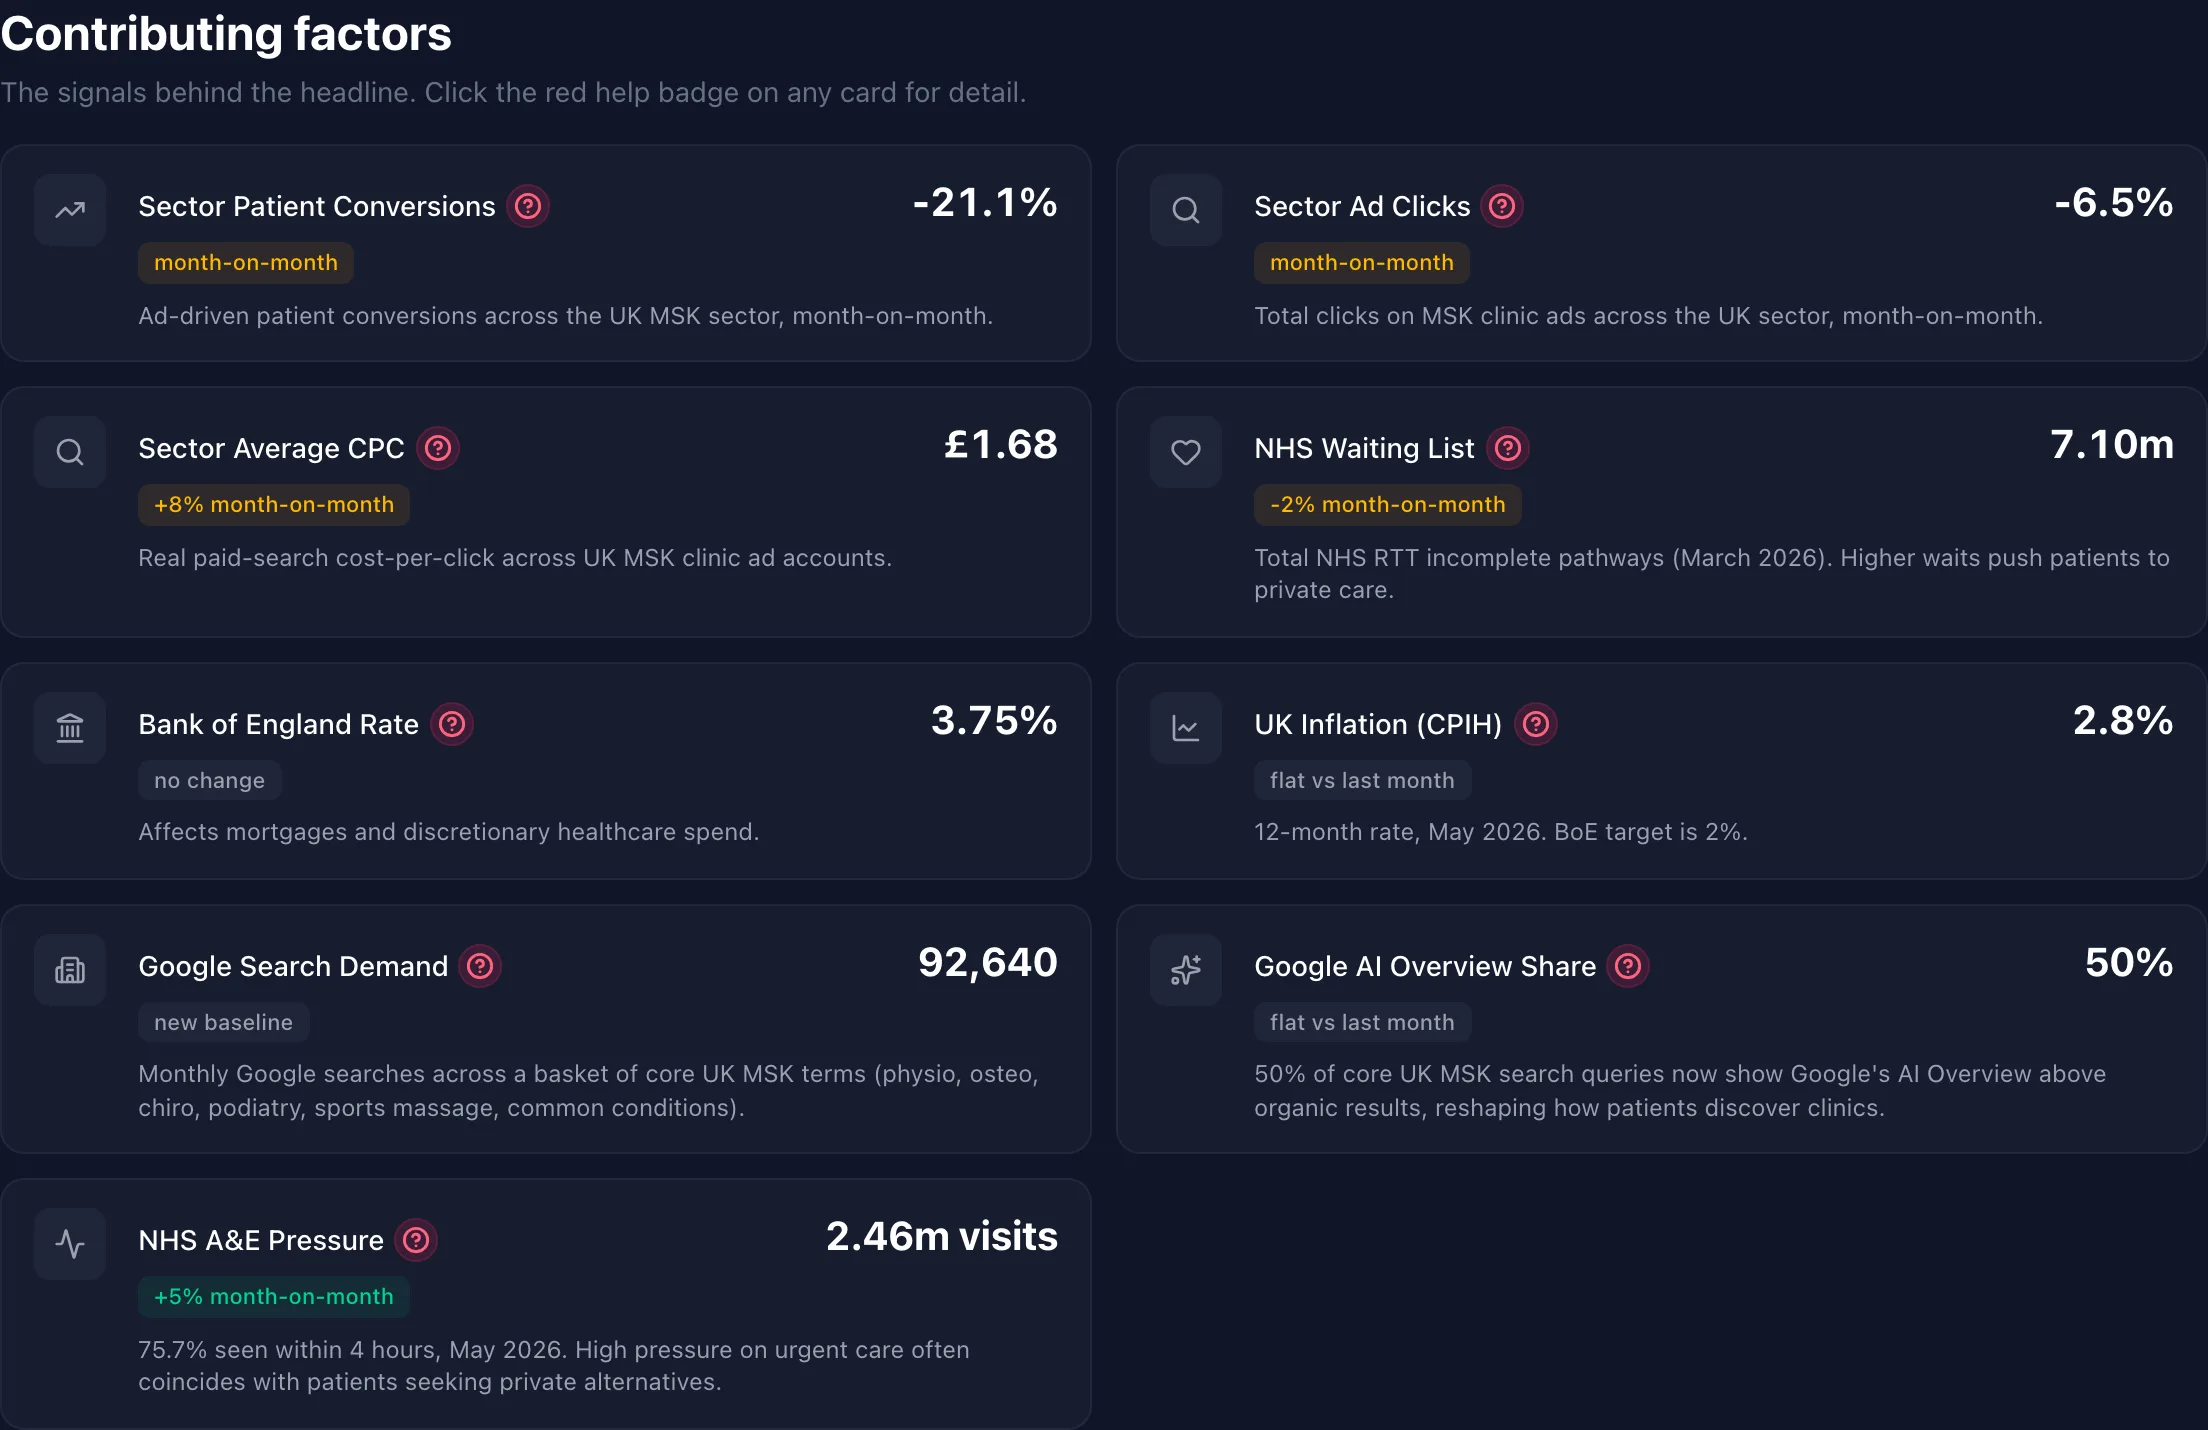
Sector conversions, ad clicks and cost per click. NHS waiting lists and urgent-care pressure. The Bank of England rate and inflation. Search demand and AI-overview share. Each with a plain line on why it matters.
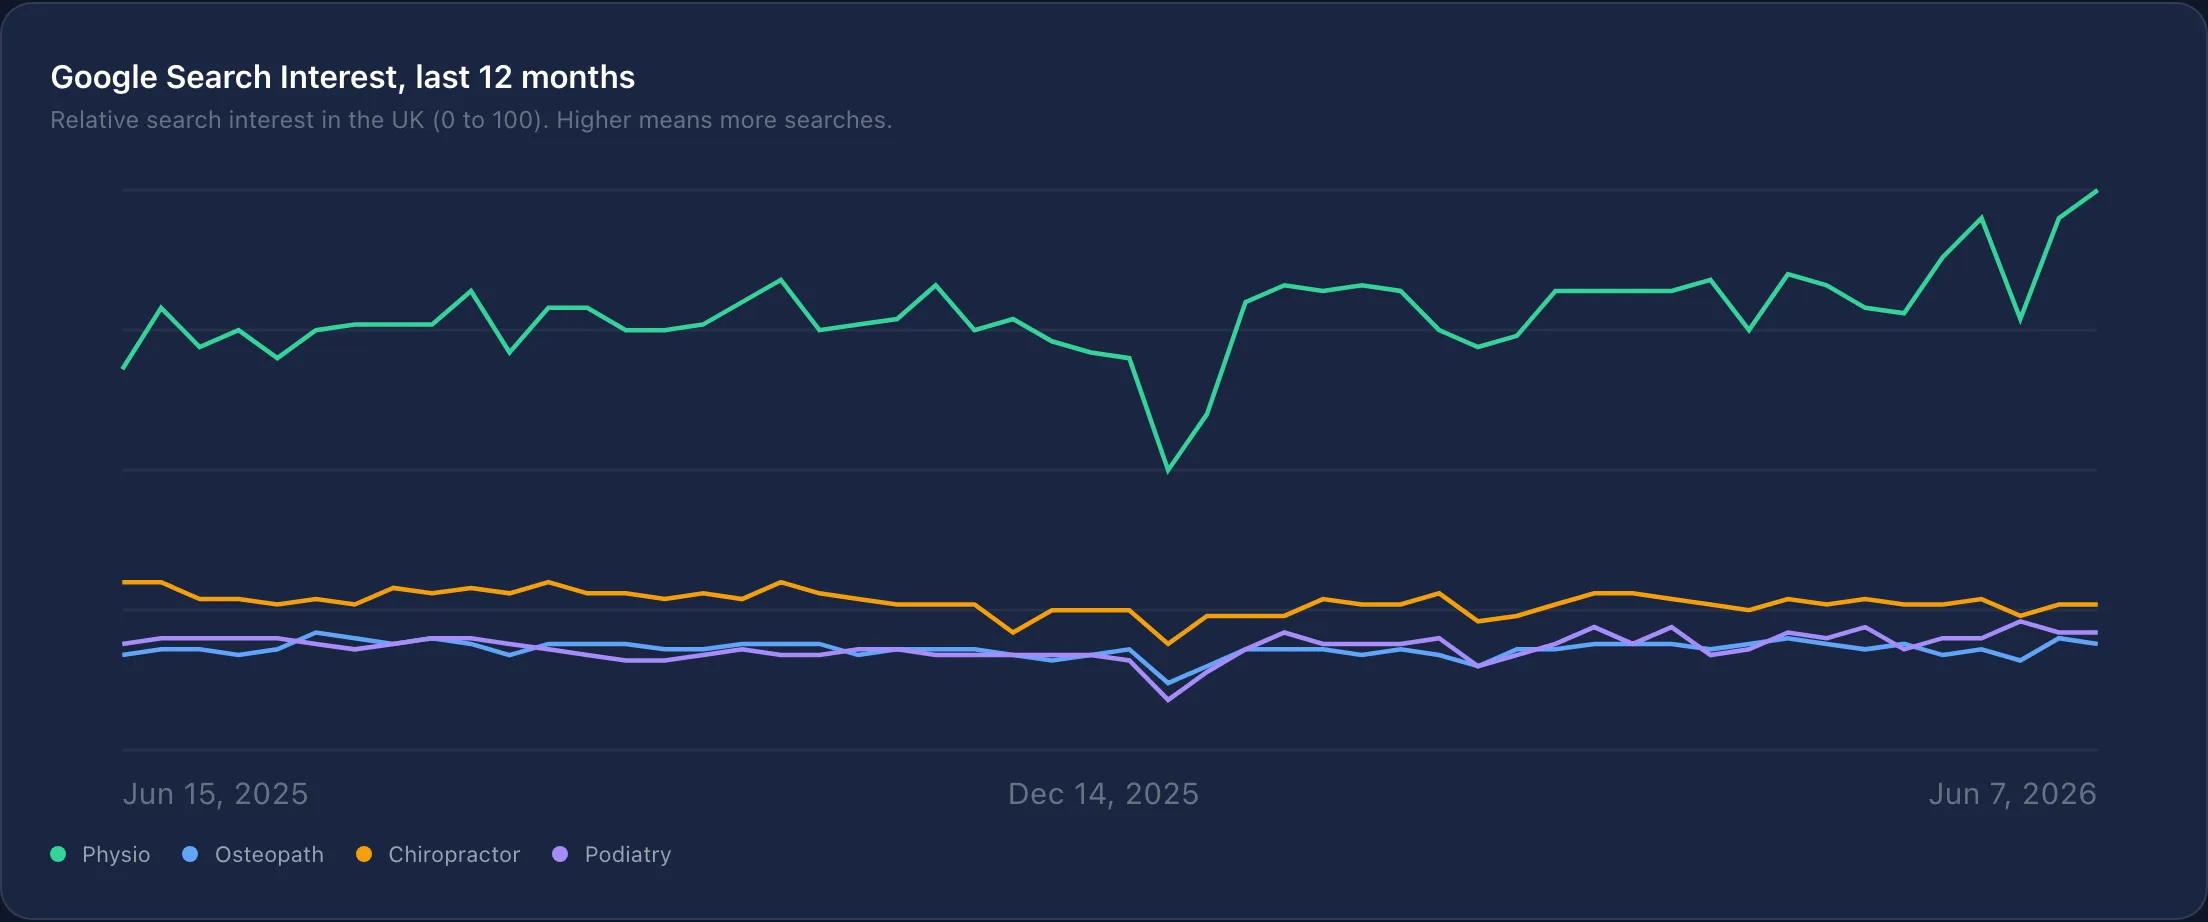
Google search interest for physiotherapy, osteopathy, chiropractic and podiatry, each on its own line, so you can see your discipline's season against the others.
The whole UK MSK market, read every week.